Statistics User Guide
Statistics helps filter operating data, count operating conditions, analyze time consumption, and troubleshoot problems. After the project has been running for a period of time, you can view the running statistics of the current project in PickWiz.
Historical data will only save the latest n piece of data, the statistical data includes all the historical data that has been run in the industrial computer.
1. Filter historical data
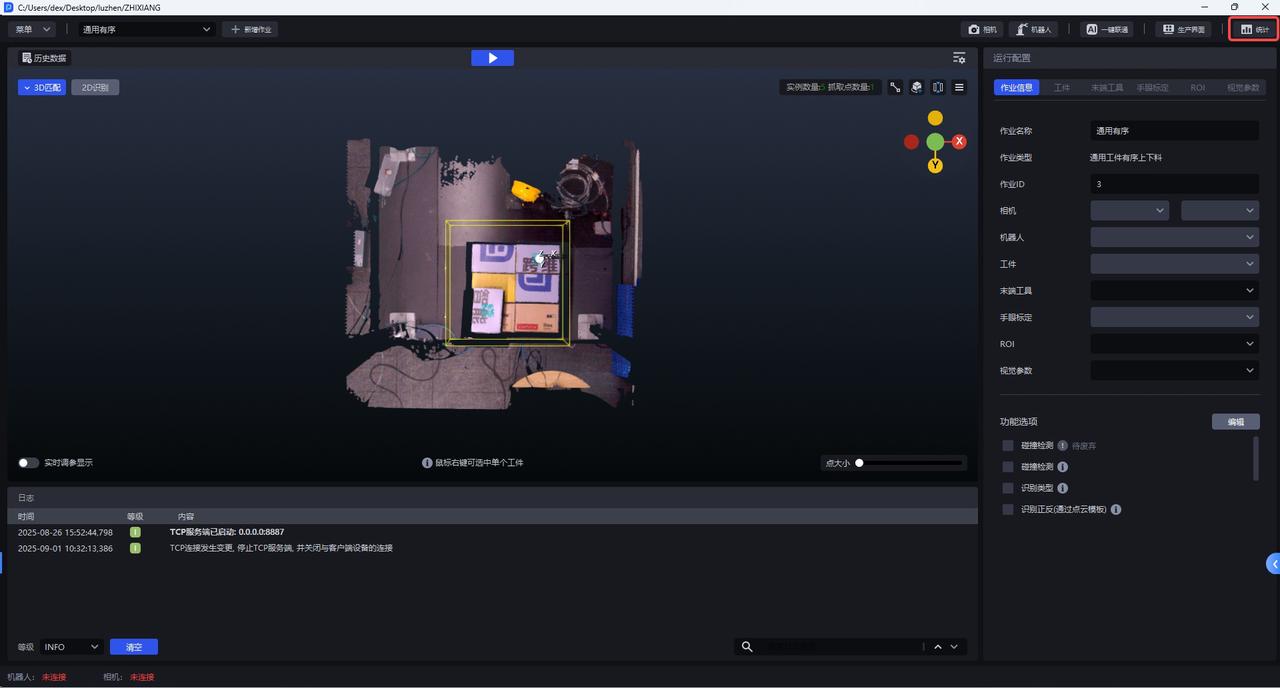
After opening the PickWiz main interface, click the Statistics button in the upper right corner to enter the statistics interface.
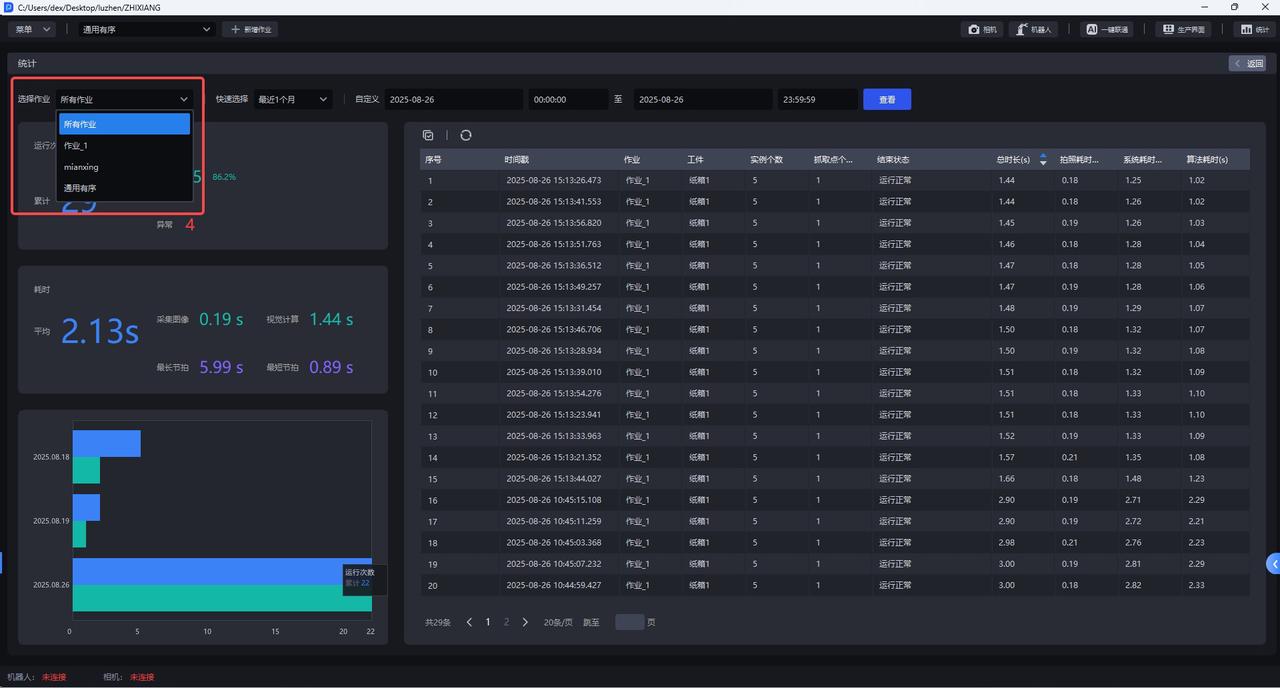
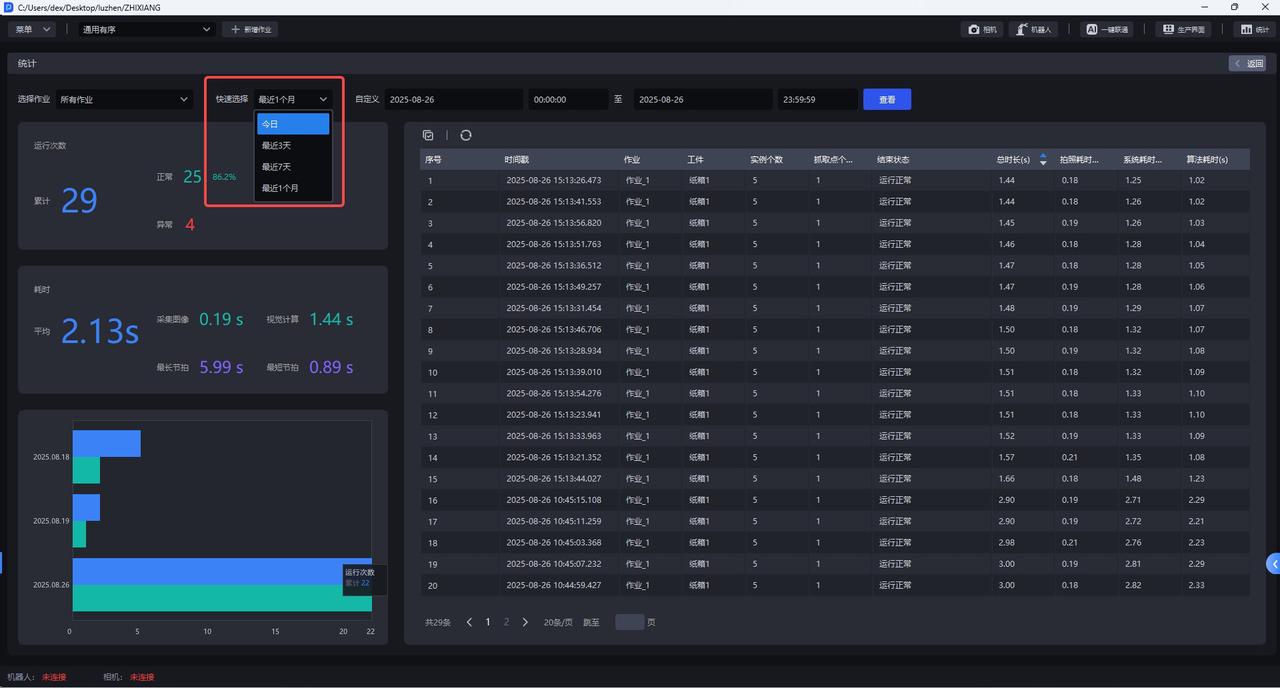
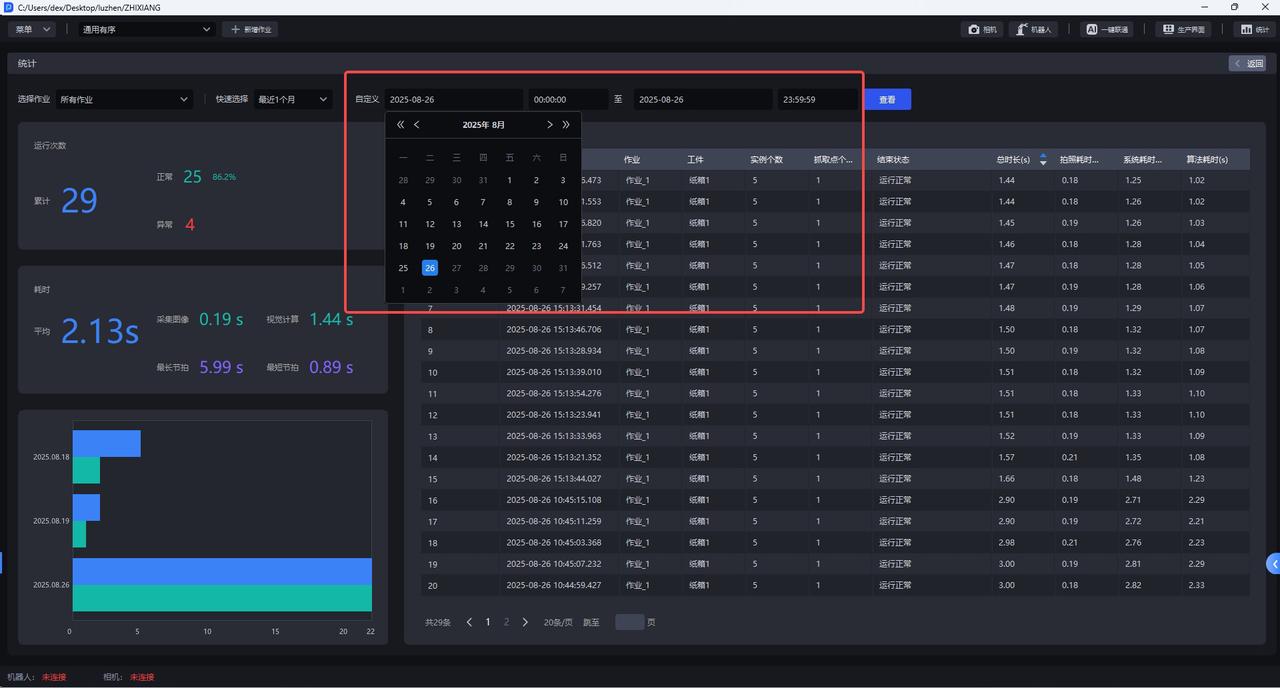
After entering the Statistics interface, you can filter historical data at the top of the interface to view statistical data within a specific Task and time range. There are three filtering methods:
Select Task: You can filter out "All Tasks" and Tasks in the current project. "All Tasks" is selected by default.
Quick Selection: You can filter out statistical data within "Today", "Last 3 days", "Last 7 days", and "Last month". "Today" is selected by default.
Customized filtering: Statistical data within a specific time range can be filtered. The range interval can be set to year, month, day, hour, minute, and second.
2. Historical Data Details
2.1 View historical data of a specific Task
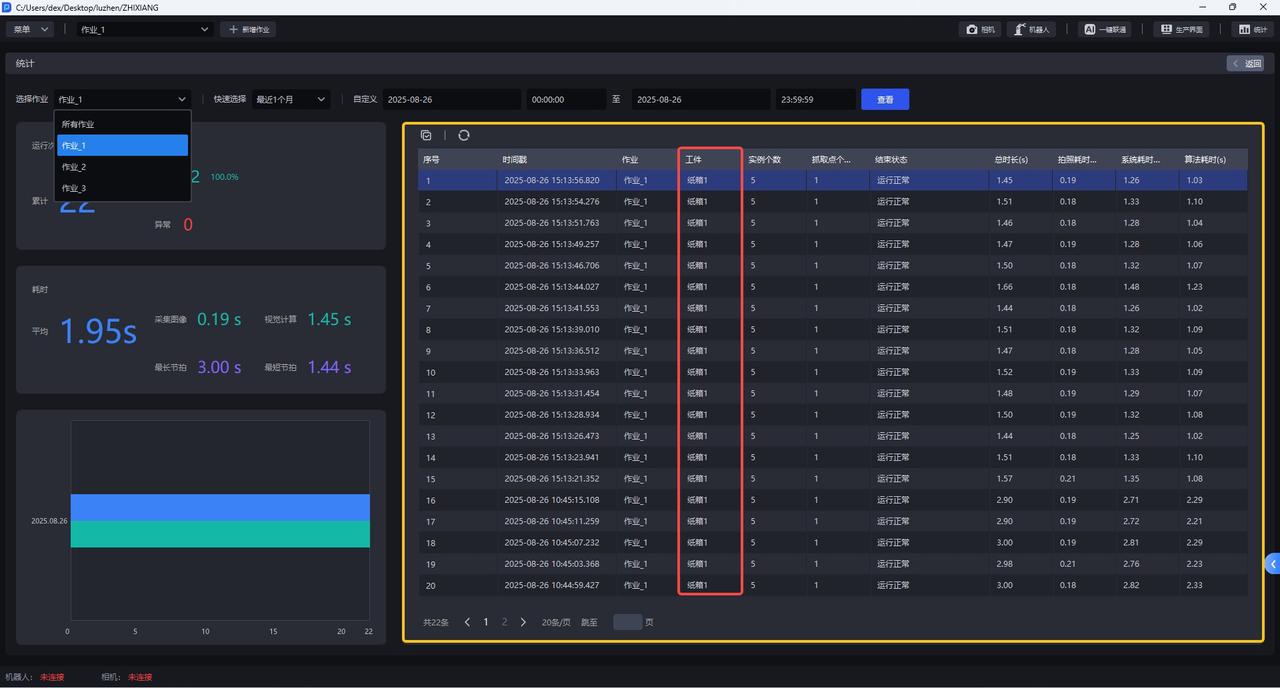
After selecting the data of a specific Task in "Select Task", you can view the historical data details of the Task on the right side of the interface.
2.2 View historical data for a specific time
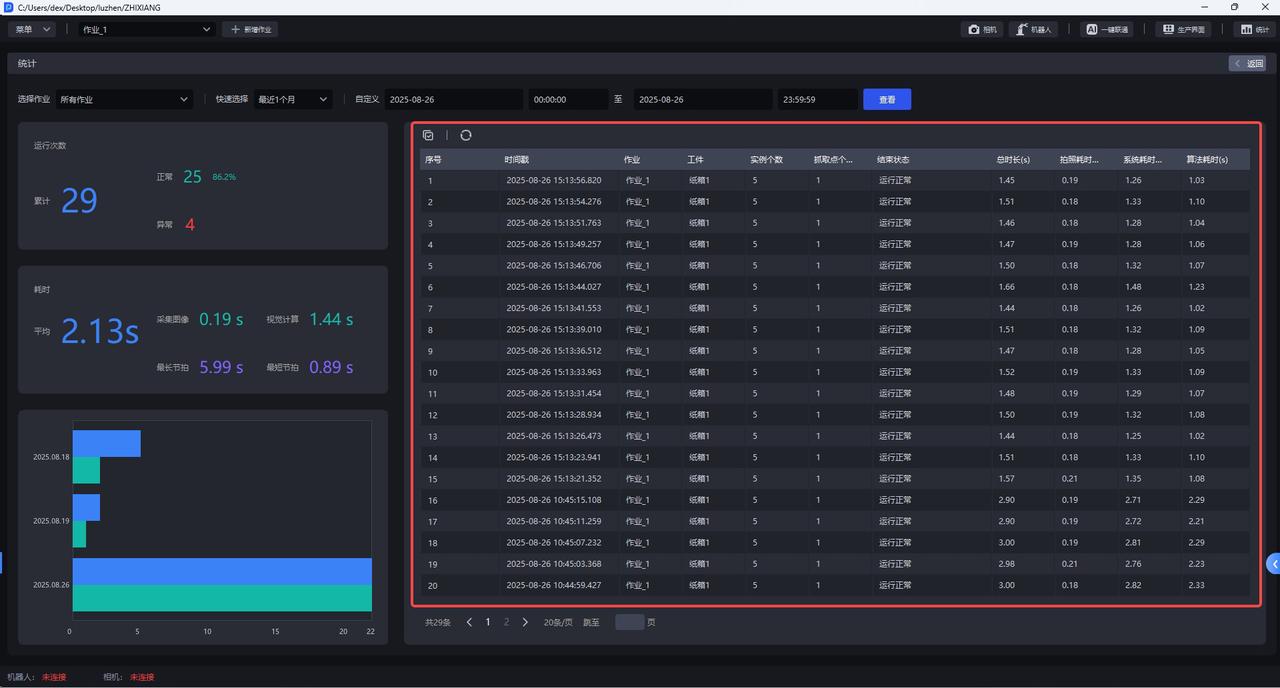
After selecting data within a specific time range, you can view the details of historical data within that time range on the right side of the interface.
2.3 data sorting
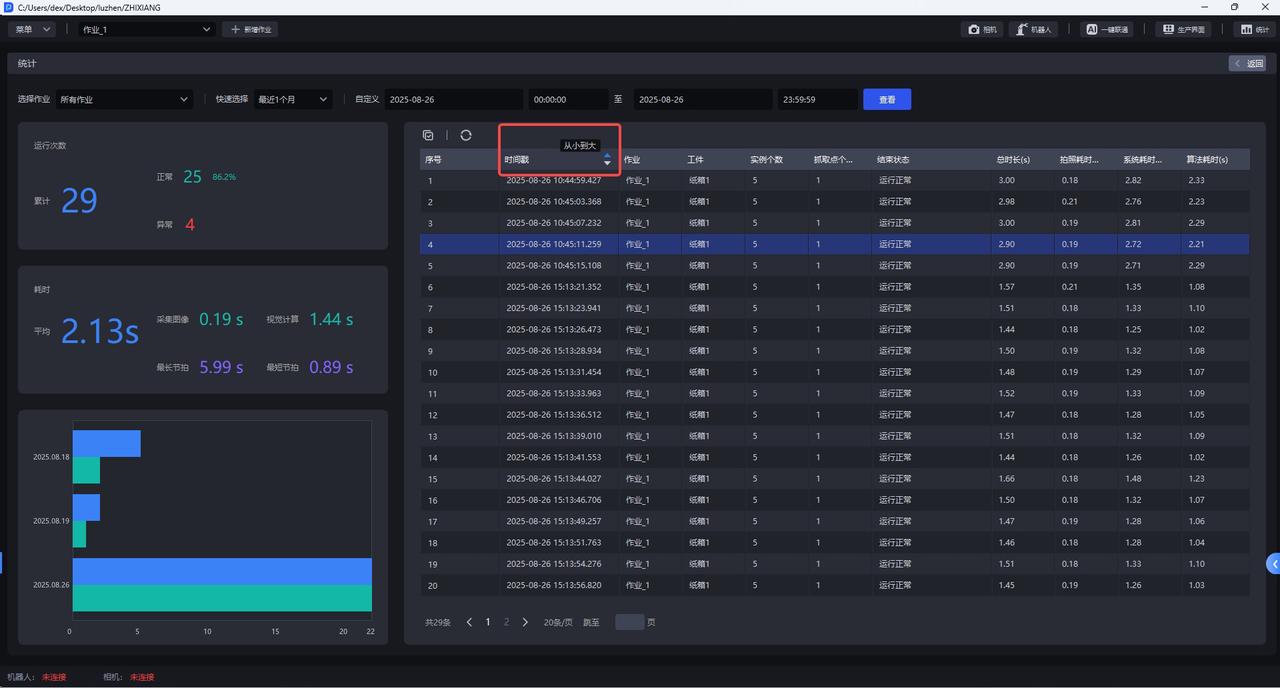
In the data table, columns such as "timestamp, total duration, photo time, system time, algorithm time" can be sorted as needed.
Click the sort icon to the right of any column title to cycle through: Ascending → Descending order.
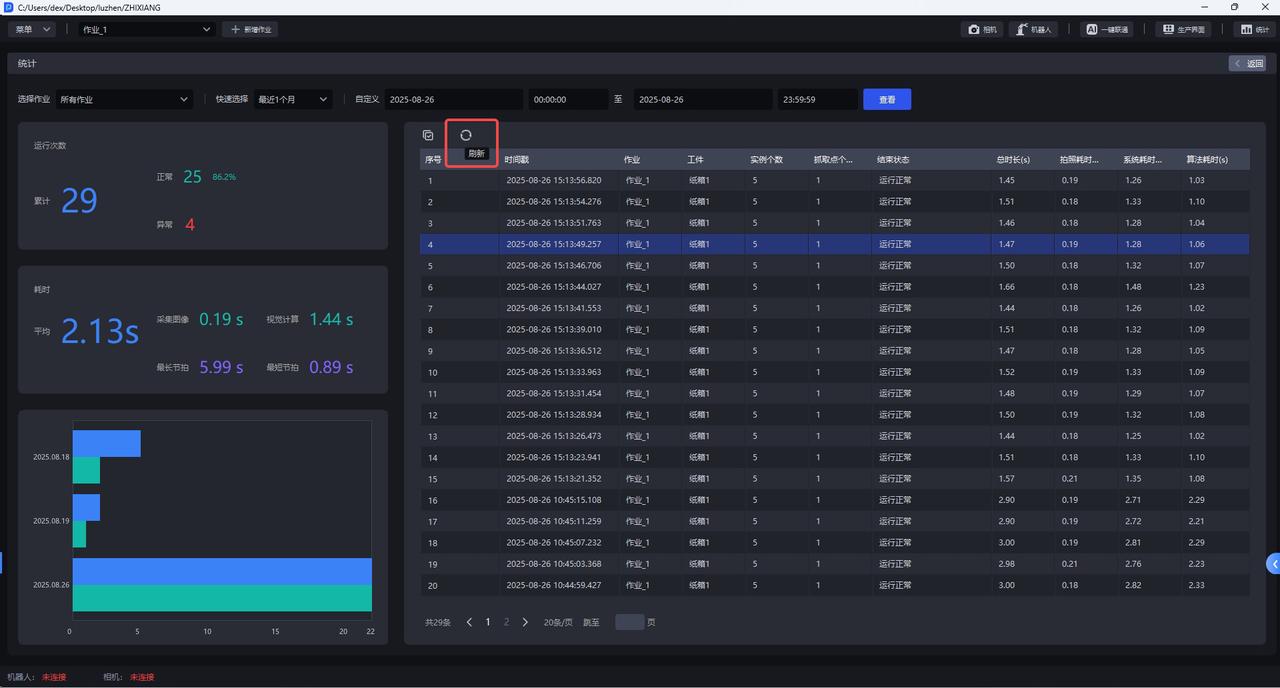
The current sorting status is indicated in real time by the direction of the icon arrow. If you need to switch to the default sorting status, click the "Refresh" icon in the upper left corner to refresh the data.
2.4 batch operation
2.4.1 batch selection
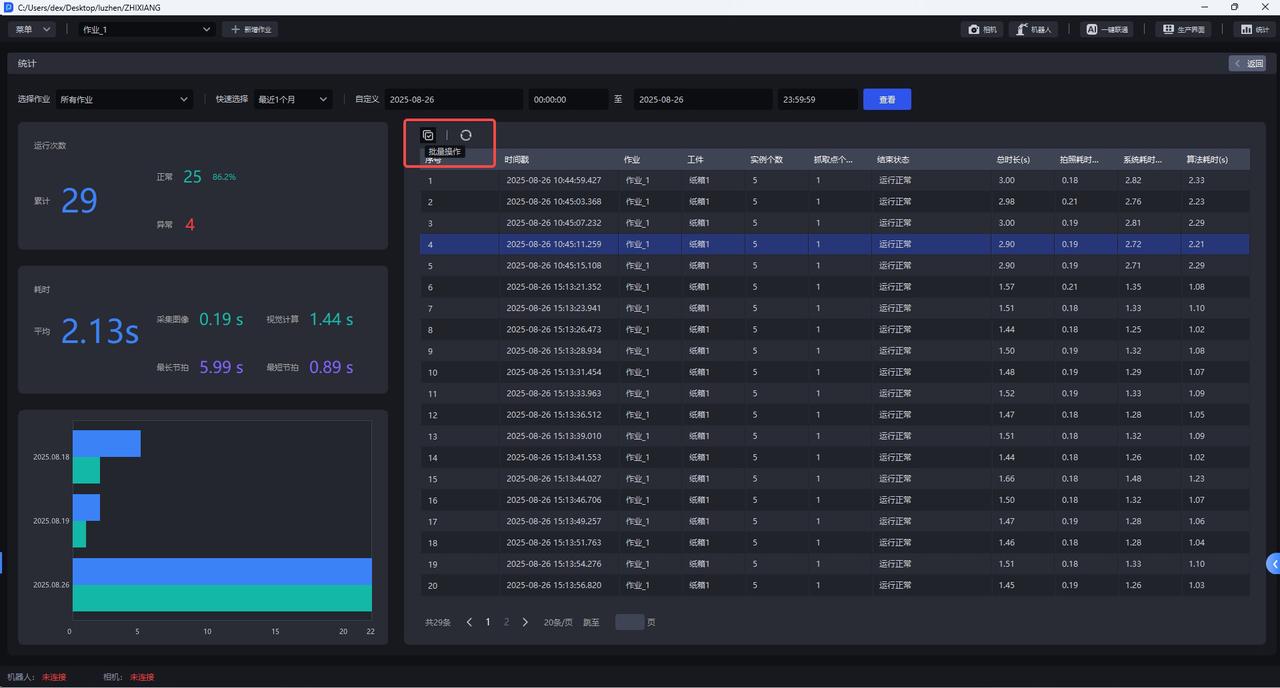
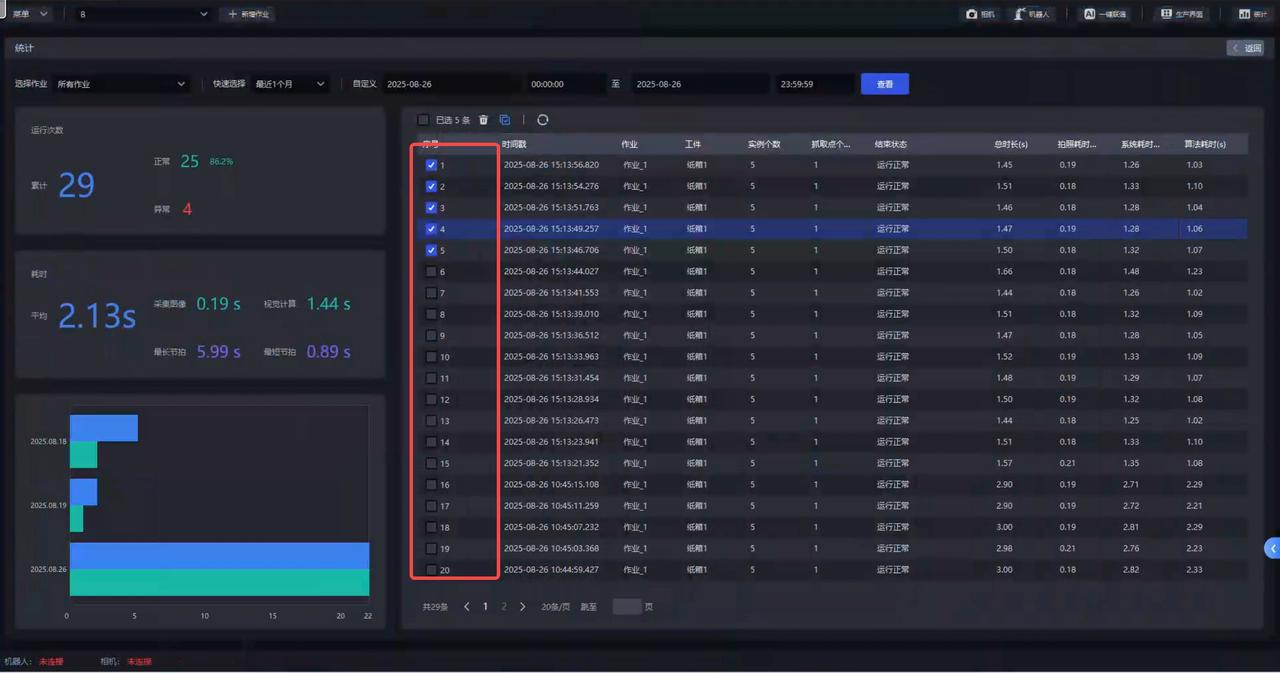
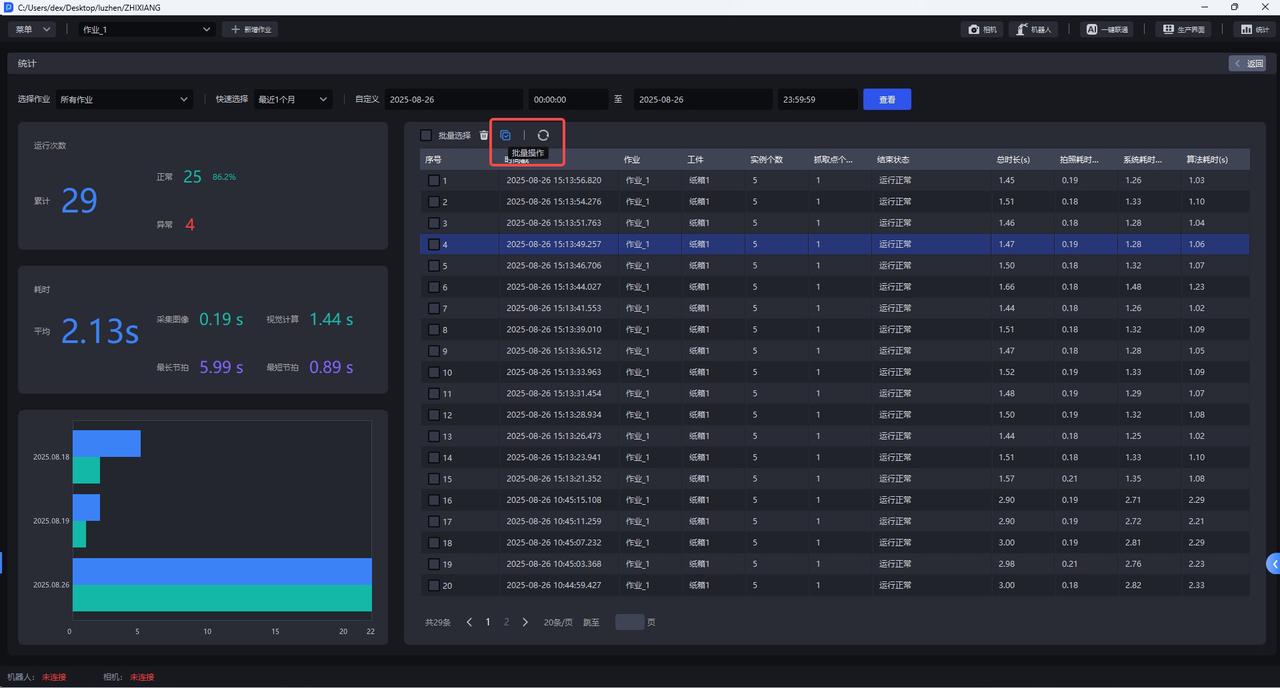
If you need to select historical data in batches, you can click Batch Operation in the upper left corner icon, check the box to select data in batches.
2.4.2 Delete
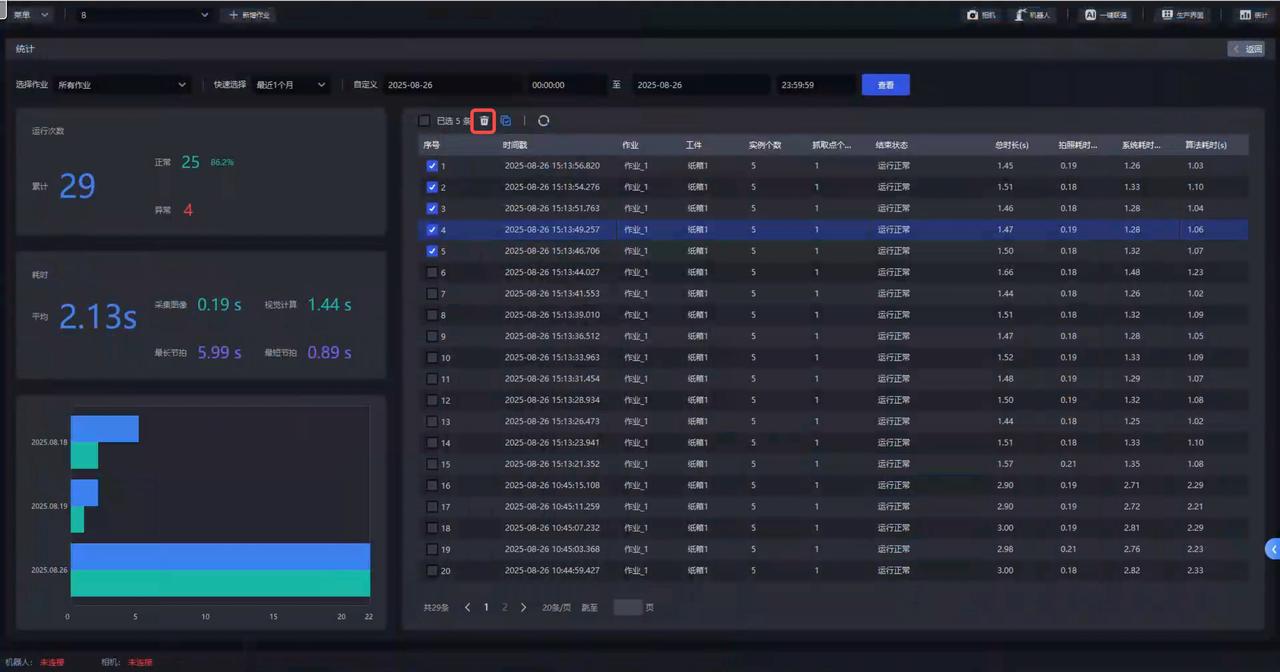
- Click the
🗑button to delete multiple historical data in batches
- Click the Batch Operation button again to uncheck the batch operation function
2.4.3 Refresh
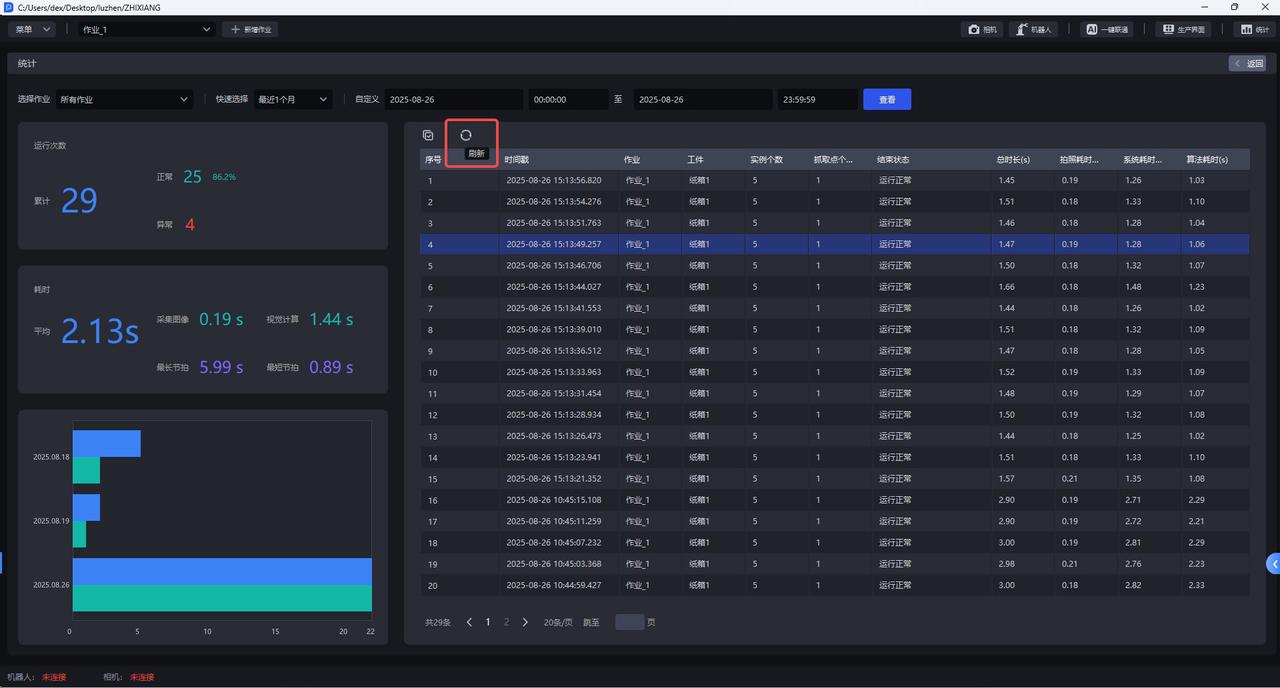
- To refresh historical data, click Refresh icon, the historical data will be refreshed to the currently selected data.
2.5 exception troubleshooting
If there is an exception in the "end status", you can click Number of runs on the left For abnormal numbers in the data section, you can view the abnormal historical data on the right side of the interface.
When you need to troubleshoot the cause of an exception, you can copy the timestamp of the abnormal historical data and search the corresponding running log in the log to troubleshoot the cause of the exception.
If the corresponding historical data cannot be found in the log, you need to go to this path to view the log record: C:\Users\dex\.dexforce\log\picklight.
3. Historical Data Overview
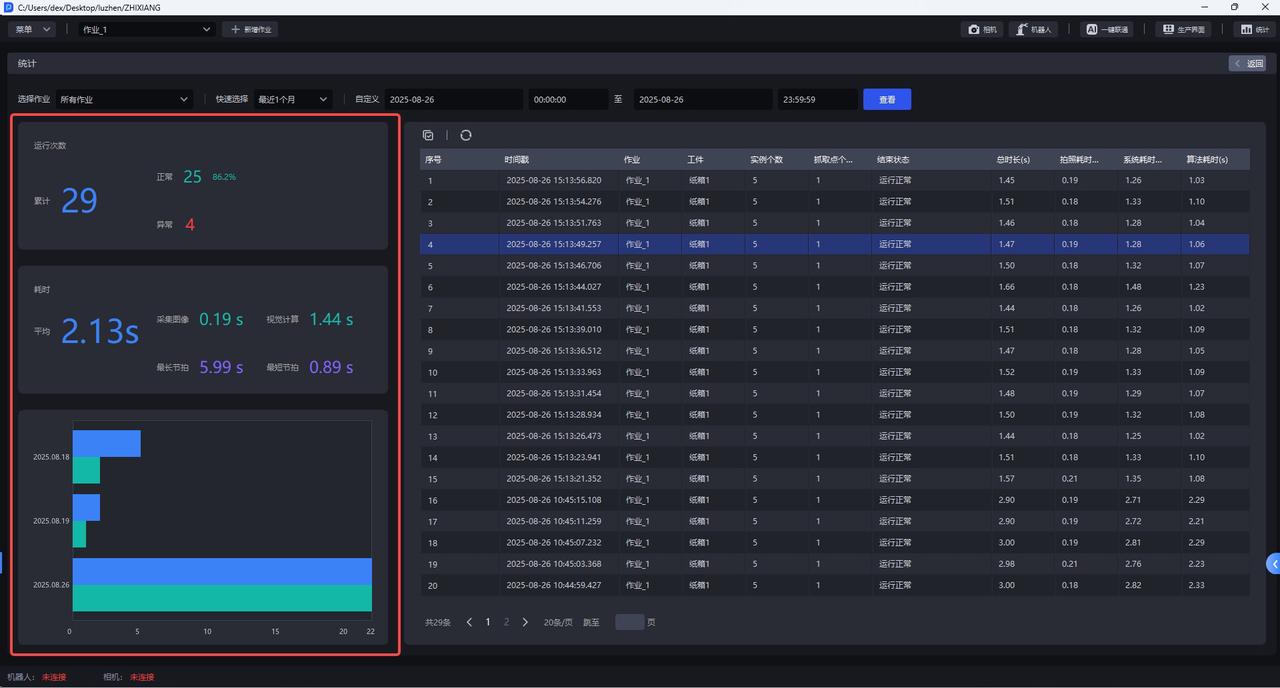
After selecting a time range, you can view an overview of historical data within that time range on the left side of the interface. The overview indicator data is generated based on the historical data on the right, mainly including the number of runs (normal/abnormal) and the time taken to run.
If there is an abnormality in the operation status or time consumption, you can copy the timestamp of the abnormal historical data and search the corresponding operation log in the log to troubleshoot the cause of the abnormality and optimize the cycle time.
| Number of runs | Description |
|---|---|
| Accumulated | Total number of runs in the selected time range |
| Normal | The number of normal operations within the selected time range. The percentage to the right of the number is the normal rate (that is, the proportion of normal operations in the cumulative number of operations). |
| Exception | The number of abnormal operations within the selected time range. Click the number to view the cause of the exception and detailed data on the right. |
| takes | Description |
|---|---|
| average | The average of the total time consumption of all running data in the selected time range, that is: the total time consumption of the filtered historical data/the number of historical data entries that produced the actual time consumption. |
| acquired image | The average time taken to take pictures of all running data within the selected time range. |
| Visual Computing | The average visual calculation time of all running data in the selected time range. |
| takes the longest time | The longest time consumption of all running data within the selected time range. |
| The shortest time consuming | The shortest time consumption of all running data within the selected time range. |
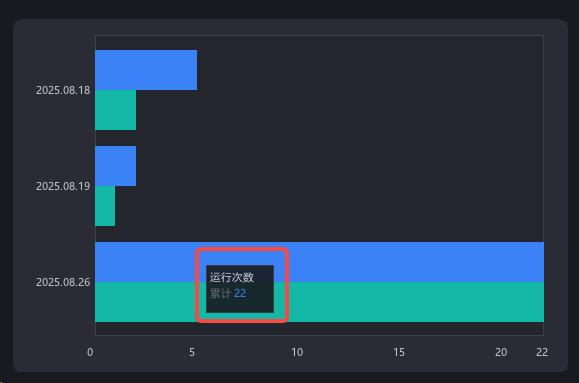
The lower left corner of the interface displays the daily operation status within the selected time range in the form of a bar chart, including the total number of runs and the number of normal runs, making it easier for users to understand the daily operation status more intuitively.