Production Interface User Guide
The Production interface can help users quickly understand the production status, project operation status, and view production results. It also provides production logs and alarm records to assist users in quickly troubleshooting, solving faults and abnormalities, and achieving stable production.
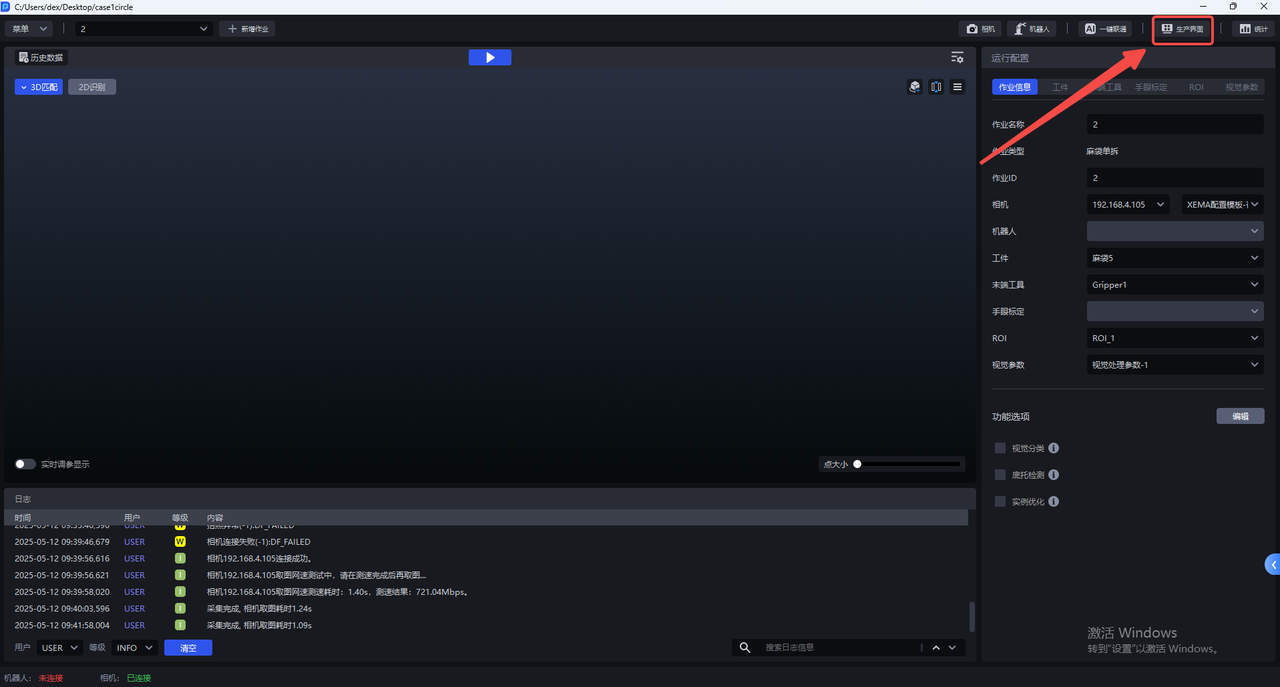
After opening the PickWiz main page, click Production Interface in the upper right corner to enter.
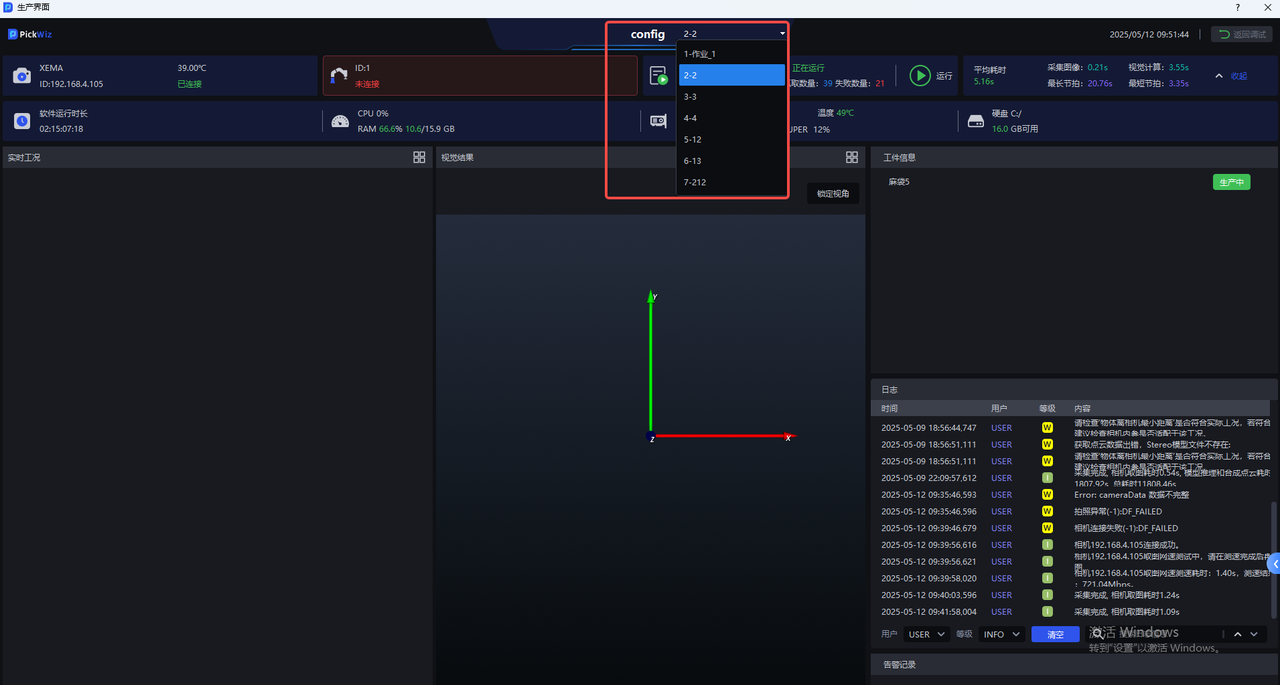
After entering the interface, you can select Task to run in the "config" area at the top of the interface to view its production information. Click the drop-down box to select a Task and view the corresponding production information. The option format is "TaskID-Task Name".
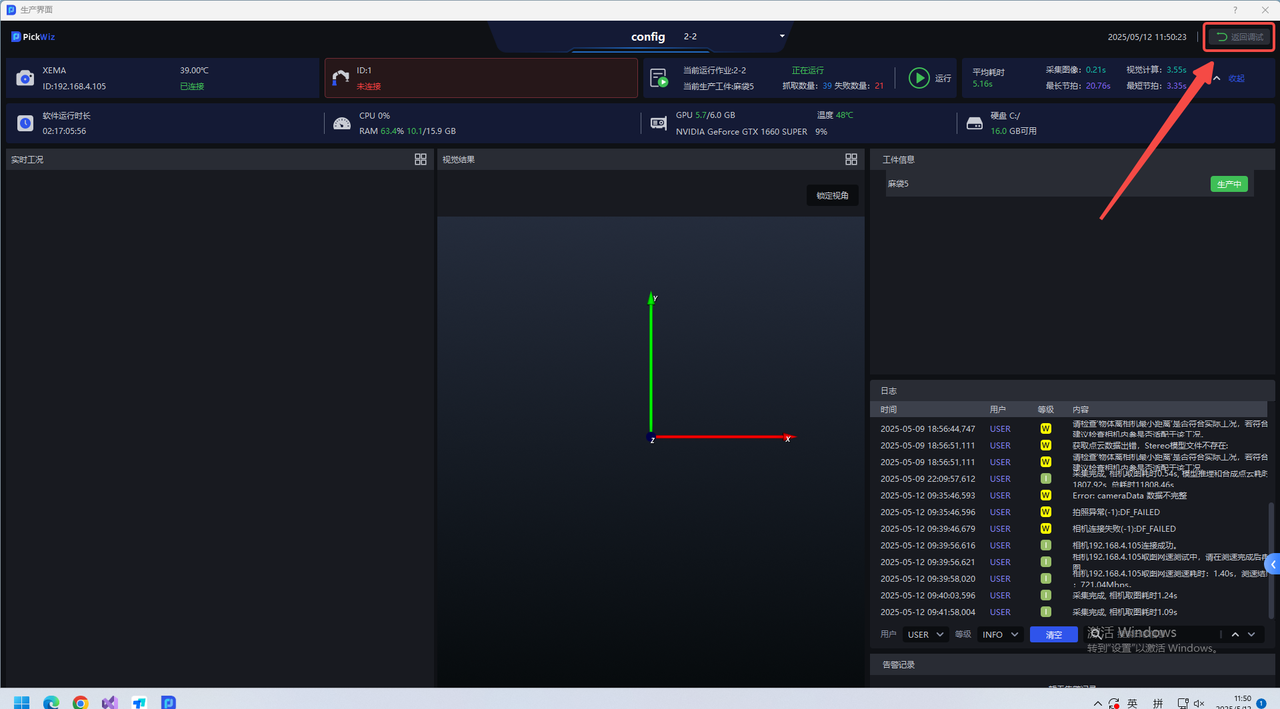
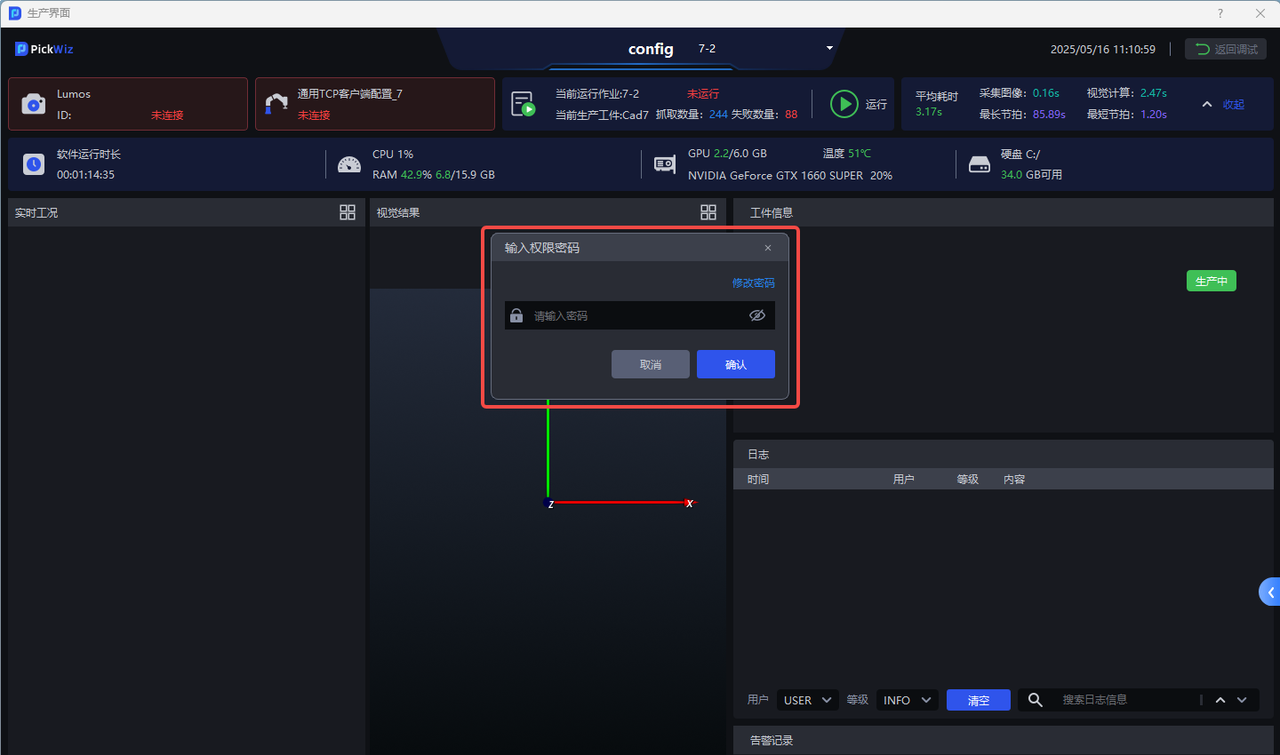
If an exception occurs during operation, or if you want to increase production with incoming materials, you need to return to the PickWiz main interface for debugging. You can click `Return to Debugging' in the upper right corner of the production interface, enter the permission password and return to the main interface. The initial permission password is the factory-set password, which can be modified in the "Enter permission password" pop-up window.
The initial password is: df123456
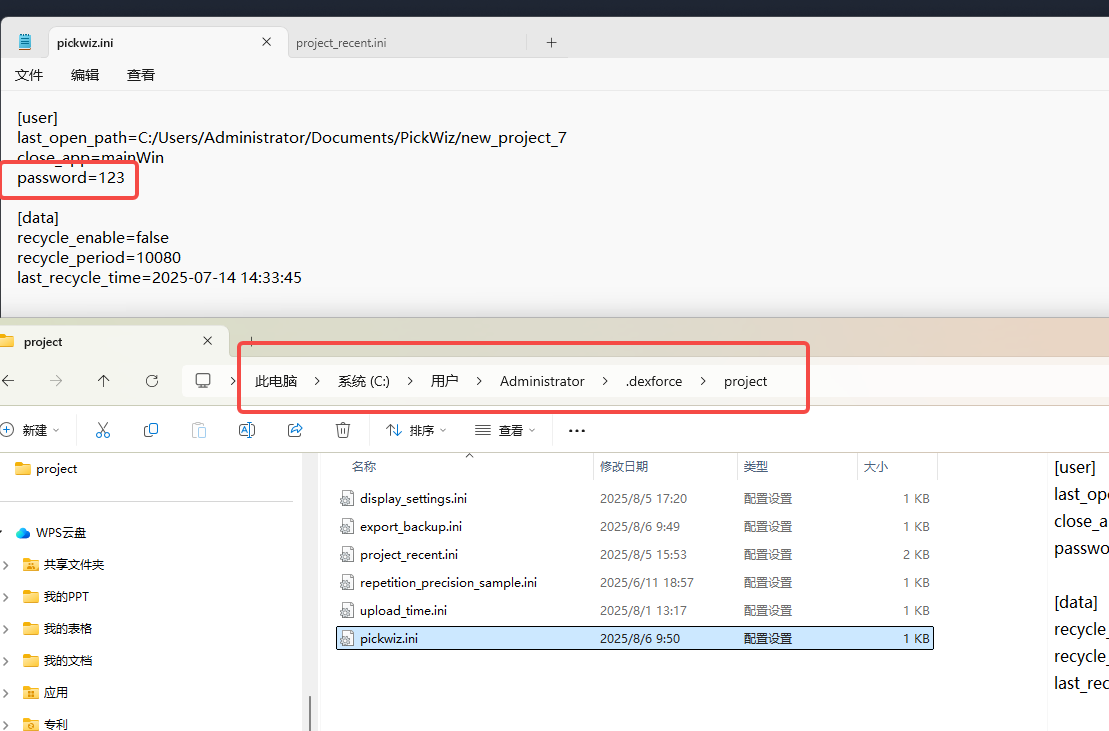
If you forget your password, you can open the file named pickwiz.ini in the C:\Users\dex\.dexforce\project folder to view your permission password on the production interface, as shown in the figure below.
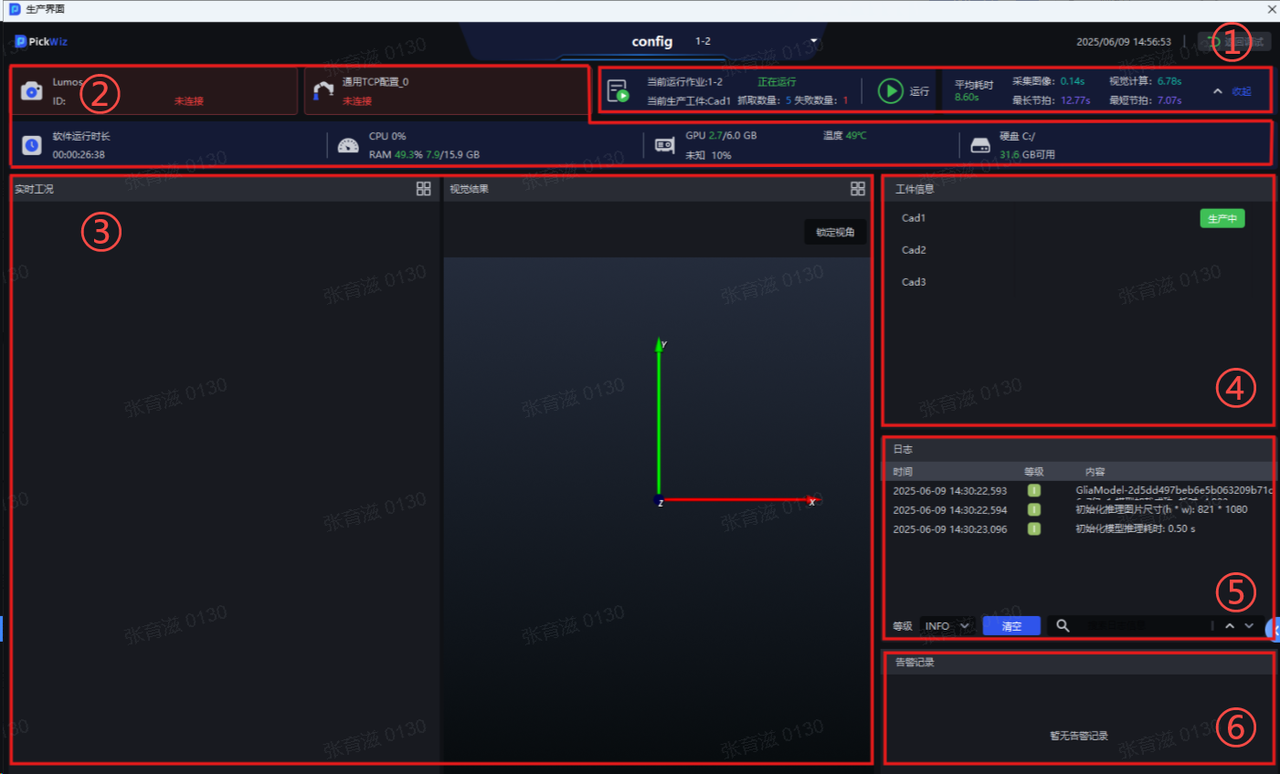
As shown in the figure below, the PickWiz production interface can be roughly divided into the following 6 modules:
| serial number | Ribbon | Function Description |
|---|---|---|
| ① | Task running area | can view the current Task running status, Task production target, number of crawls, number of failures, time consumption, etc., and can run Tasks that are not running |
| ② | Production status area | Check Camera connection status, Robot connection status, hard disk space, system monitoring status, etc. |
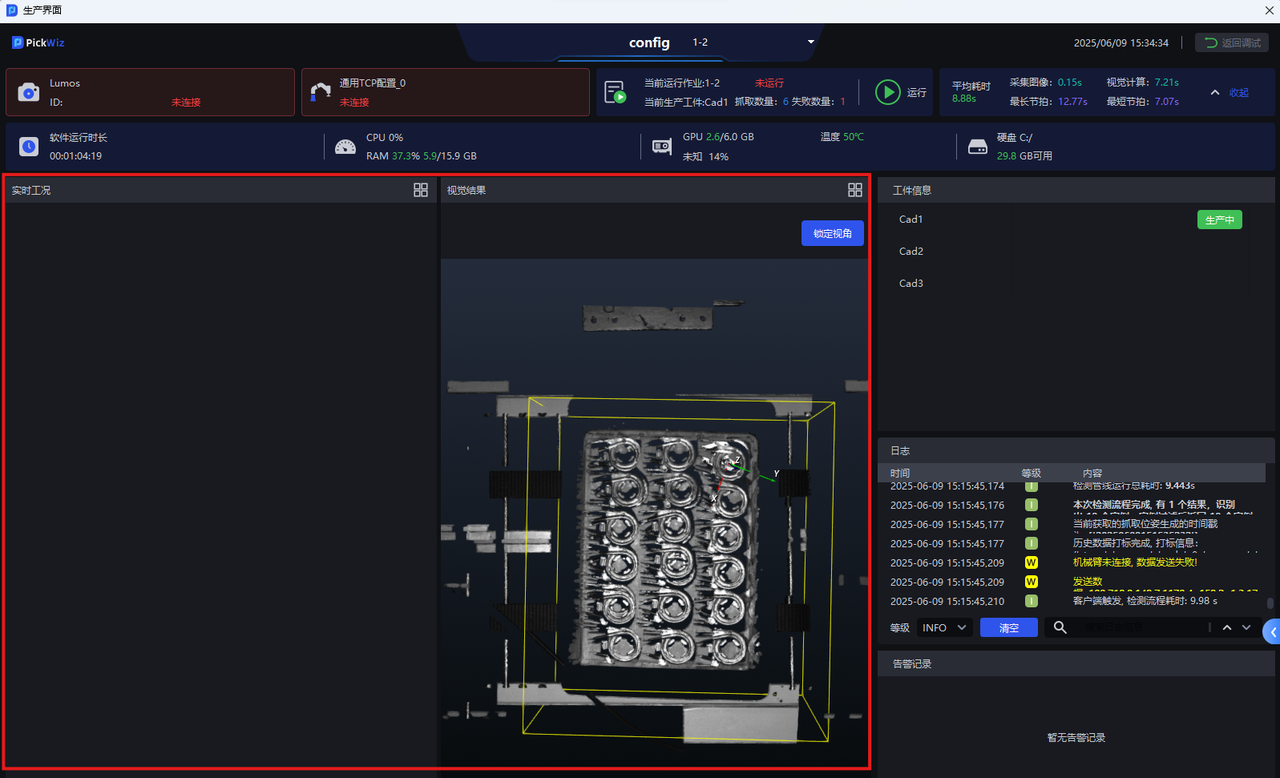
| ③ | Visualization area | View the live status of the workstation, recognition results, grabbing poses, grabbing sequence, etc. |
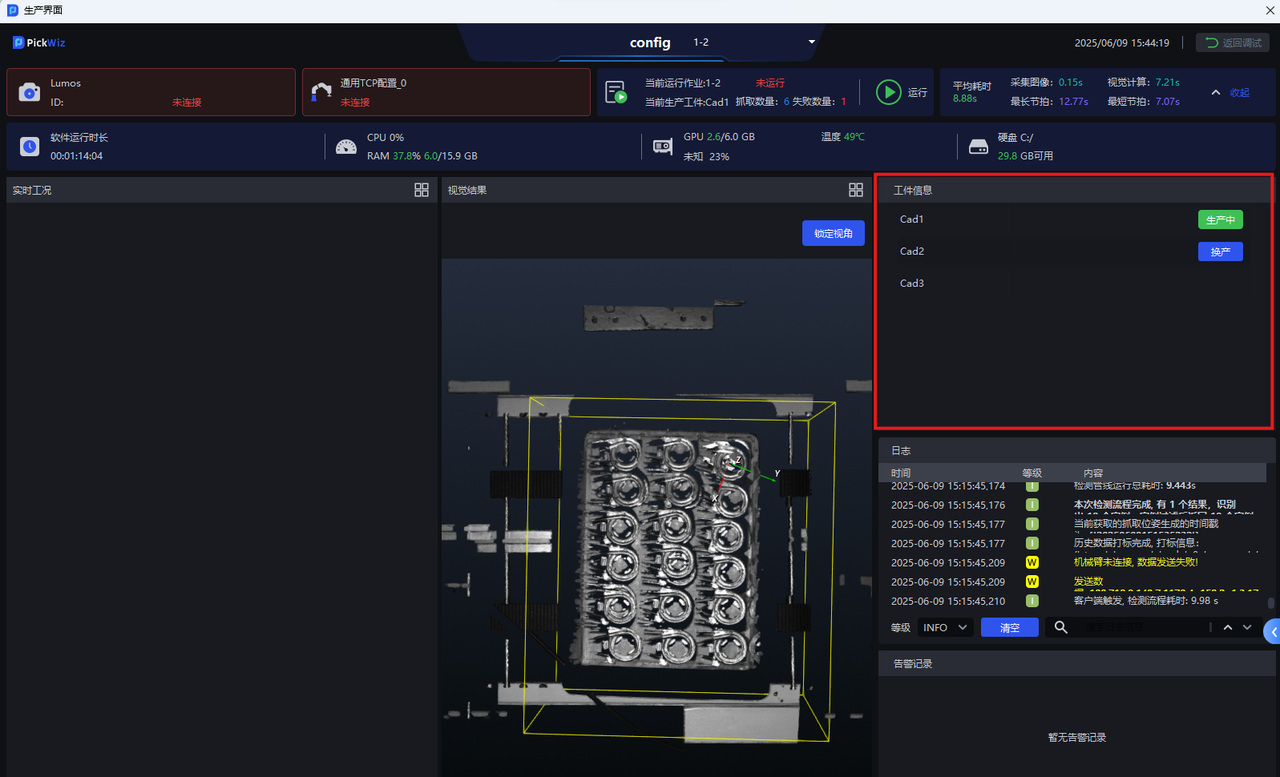
| ④ | Target area | Check that the target has been configured for the current task and implement the production change |
| ⑤ | Log Area | View PickWiz Visual Log |
| ⑥ | alarm zone | View running alarm records |
1. Task running area
You can go to the status area at the top of the production interface to view the Task running status during the production process and view the Task time-consuming information, as shown in the figure below.
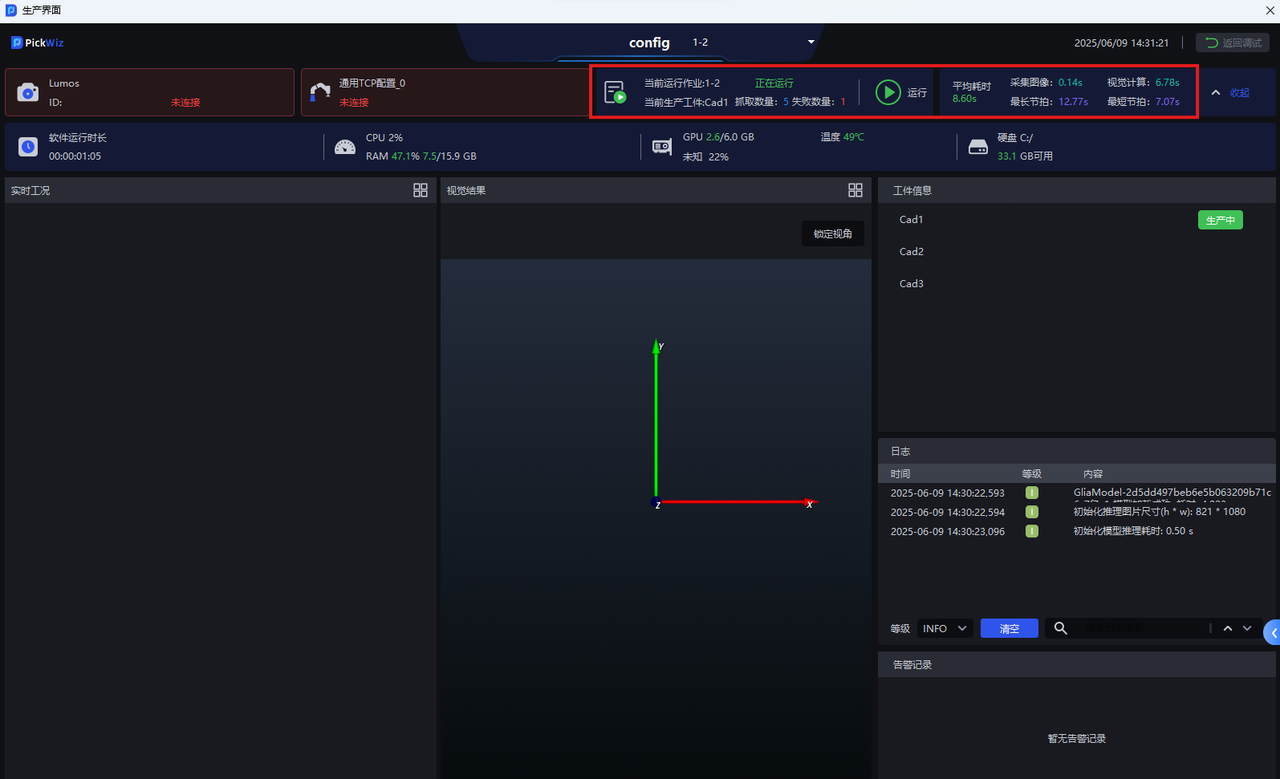
 | Current Task running status | You can view the current Task production status, Task production Target, number of crawls, and number of failures |
|---|---|---|
 | Run the current Task | Click to run the current Task |
| — | Time-consuming information | Task running average time-consuming information, including the average total time-consuming for a single run, the average time-consuming for image acquisition, the average time-consuming for visual calculation, and the longest and shortest Cycle time among all runs |
2. Production status area
When using the production interface, you can go to the status area at the top of the production interface to view the status of various aspects of the production process, as shown in the figure below.
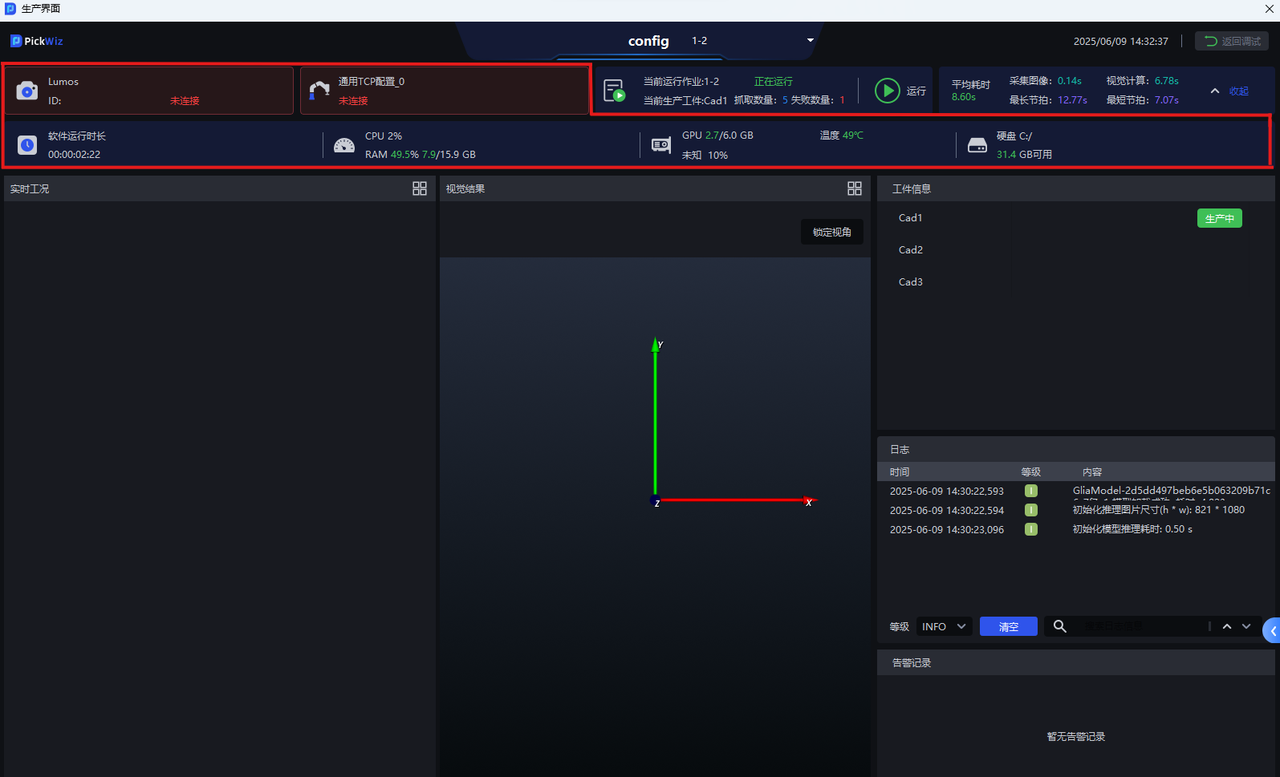
| Icon | Status/Action | Description |
|---|---|---|
 | Camera connection status | You can view the Camera connection status, as well as the current Camera brand, ID, and temperature |
 | Robot connection status | You can view the Robot connection status and the current RobotID |
 | Software running time | You can view the software running time |
 | CPU and memory status | You can view the CPU and memory status (the percentage after CPU indicates CPU utilization) |
 | Graphics card status | You can view the graphics card status (percentage indicates GPU utilization) |
 | Hard disk status | You can check the usage status of the hard disk where the system is located. Insufficient disk margin will affect the stable operation of the system |
3. Visualization area
As shown in the figure below, real-time working conditions and visual results can be viewed in the visualization area. You can click Lock perspective in the upper right corner of the visualization area to keep the 3D perspective unchanged before and after the Camera takes pictures during the running process.
4. Target area
The name and status of the Target involved in production can be viewed as shown in the figure below. When the Target type of incoming materials changes, such as switching from Target1 to identifying Target2, you can click Target2, and then click the `Change Production' button that appears next to the corresponding Target to identify and capture Target2, thereby realizing the production change.
5. Log area
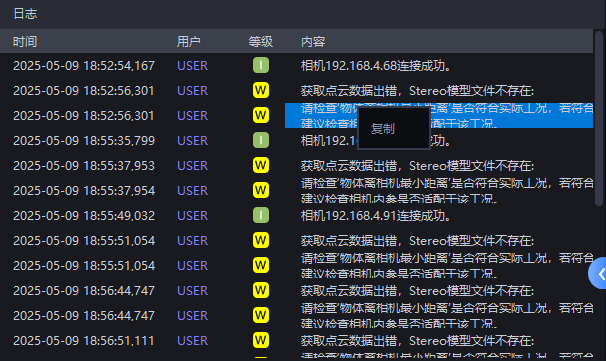
The production log records can be viewed in the lower right corner of the production interface.
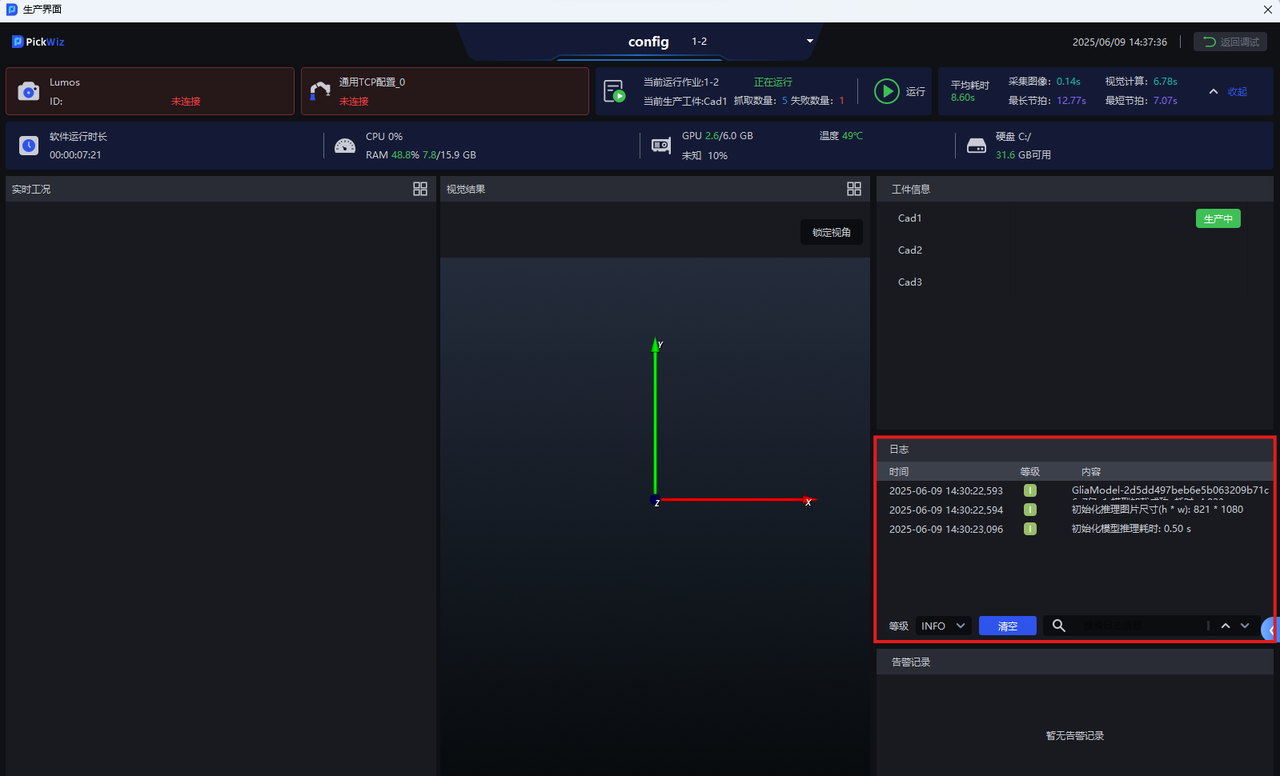
If you need to copy the log content, right-click the log content and click "Copy". If you want to clear the log content, please click the blue Clear button below.
6. Alarm area
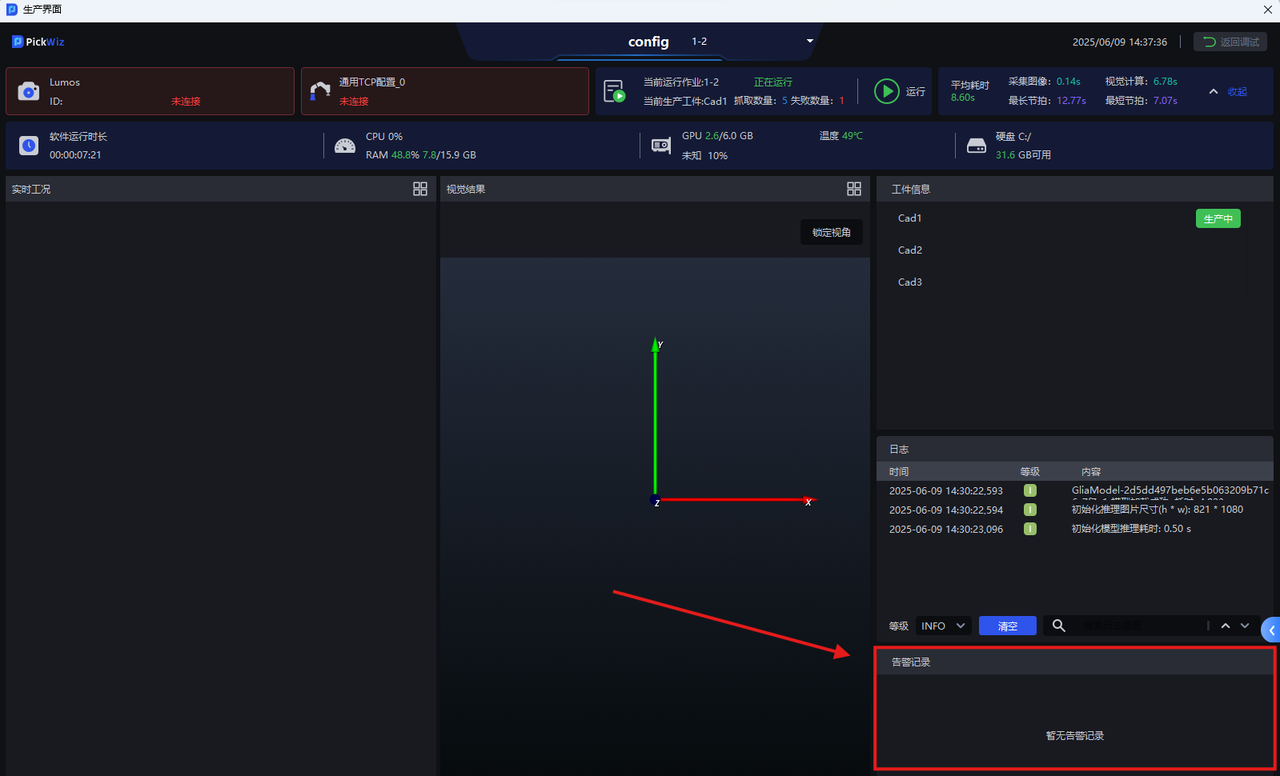
During the production process, you can view relevant alarm records when the project is running in the "Alarm Records" section.
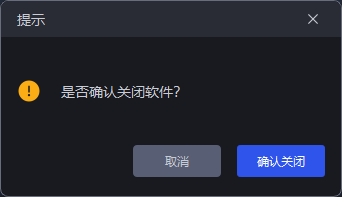
If you want to close the production interface, you can click the software close button in the upper right corner of the interface, and then click 'Confirm Close' in the pop-up window to exit the production interface. After closing the production interface, the PickWiz main interface will also be closed.