Calibration result inspection and analysis
After the calibration is completed, the calibration results need to be checked to determine whether the accuracy of the calibration results can meet the accuracy requirements of the actual Scene. If the 'calibration error' exceeds the normal range, you need to locate the cause of the error, recalibrate after solving the problem, and check again until the accuracy of the calibration results meets the Scene requirements.
1. Calibration diagnosis
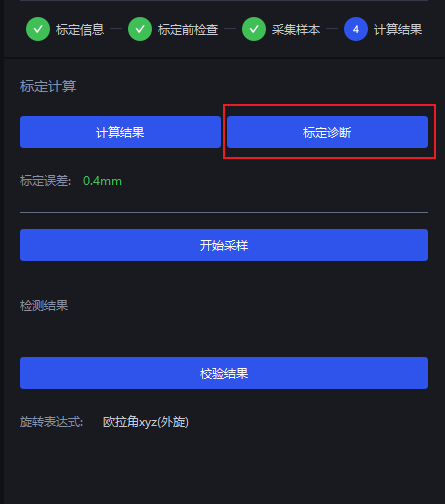
Click Calibration Diagnosis in Calibration Calculation, and PickWiz will draw the relevant analysis graph in the visualization window on the left.
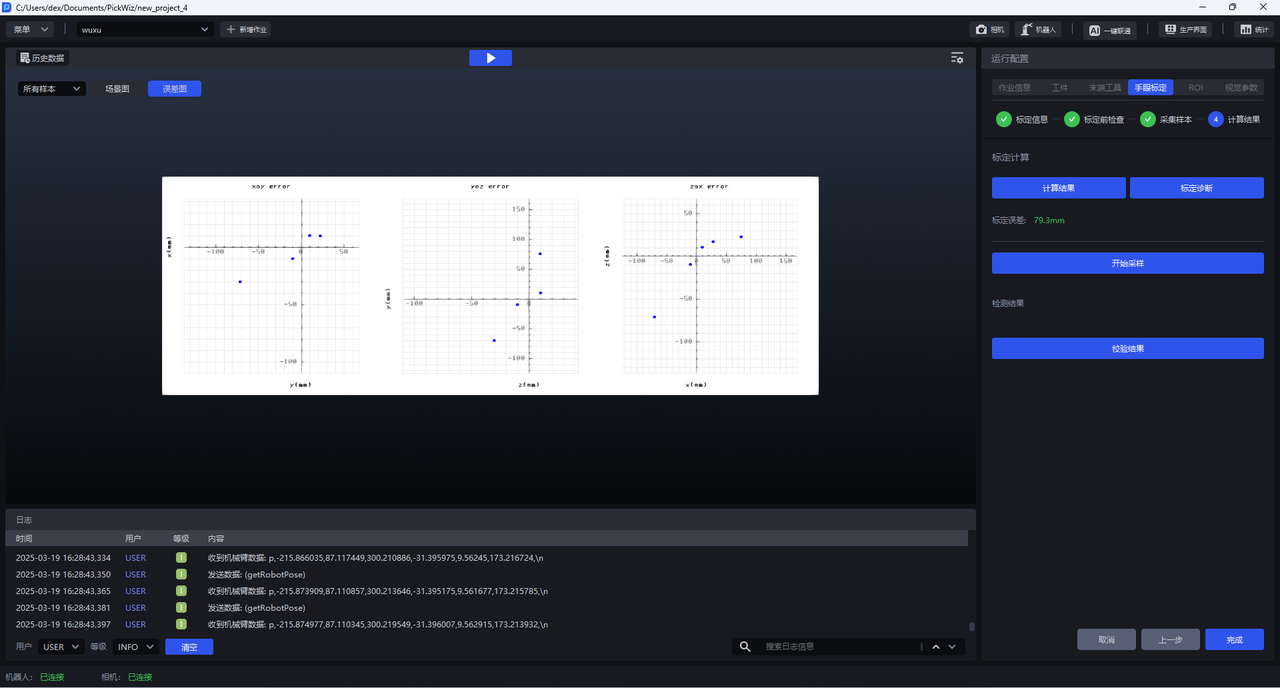
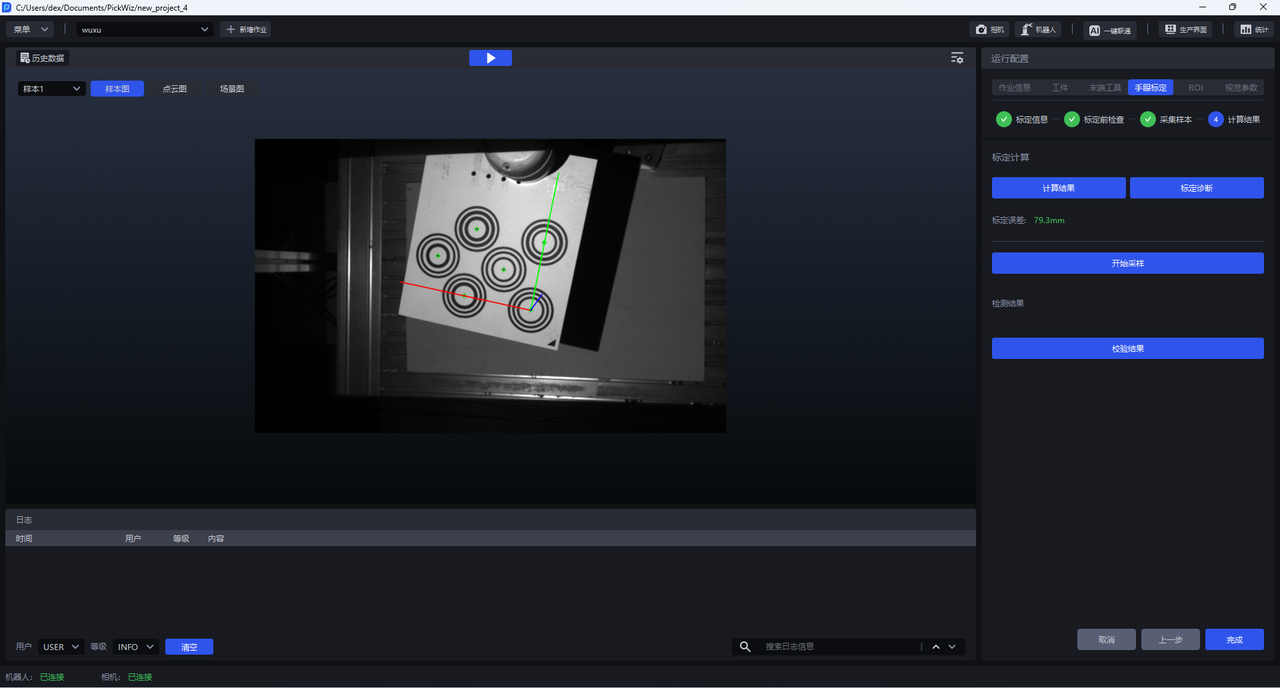
In the visualization window, you can view the Scene graph and error graph of all samples, as well as the saved sample graph, Scene graph, and Point Cloud graph of each sample, as shown in the figure below.
1.1 error graph
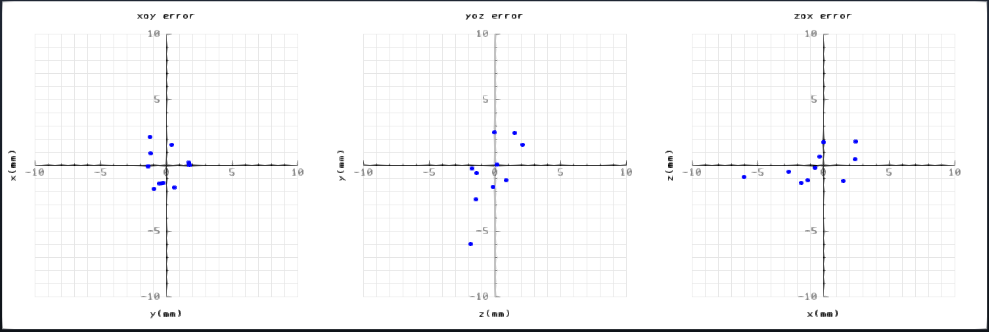
The error graph is used to show the deviation between the true position and the calculated position of each circle center on the Calibration Board. There are three error diagrams, which display errors on three planes: XoY, YoZ, and ZoX. Each plane takes the true position of the center of the Calibration Board circle as the origin. By observing the deviation of the calculated position on these three planes, you can intuitively see the deviation of each circle center in different directions. One small grid represents one millimeter error.
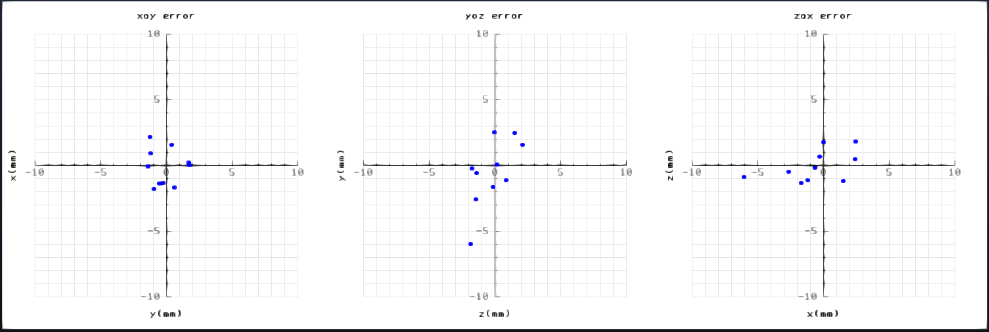
Check the distribution of dots on the three pictures. If the dots on the three pictures are all distributed in the center, it means that the error between the real position and the calculated position of each circle center on the Calibration Board is small, and the calibration results are available, as shown in the figure below.
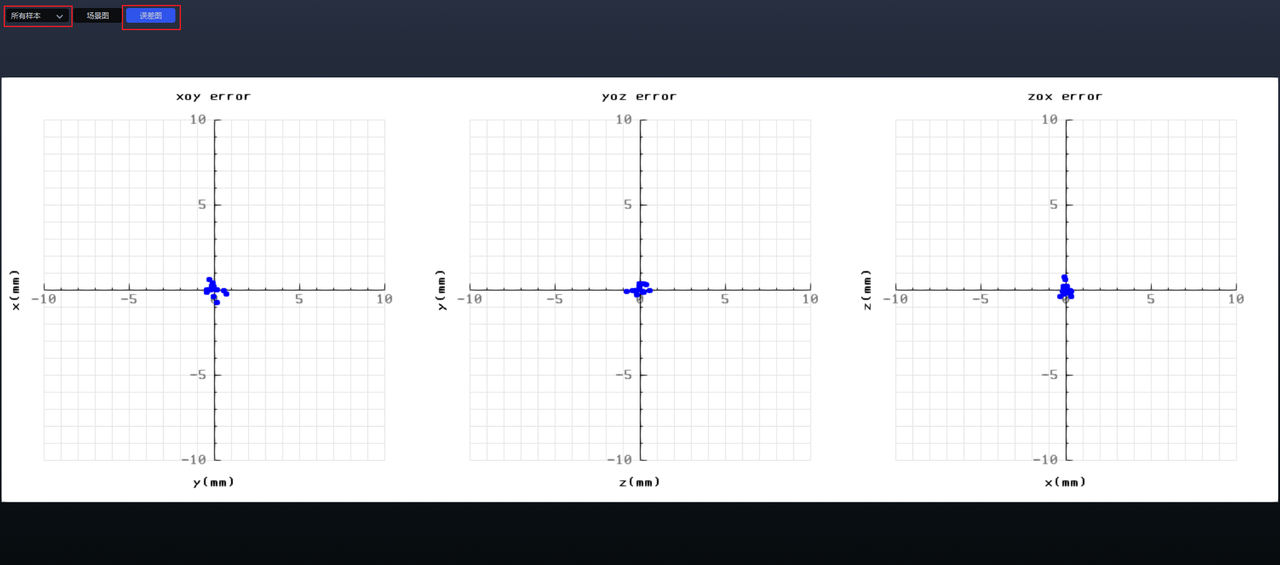
If the distribution of dots is discrete, it means that the error between the true position of the circle center on the Calibration Board and the calculated position is large, and the calibration result is unusable. You need to filter the sample or recalibrate, as shown in the figure below.
1.2 Scene diagram
The Scene diagram is used to display the posture distribution of the Robot's base and the end of the robotic arm during sampling. The larger coordinate axis represents the coordinates of the Robot's base, and several smaller coordinate axes represent the coordinates of the end of the robotic arm for each sampling.
During calibration and diagnosis, only structured light cameras (Xema, Finch, and Sparrow series cameras) have ScenePoint Cloud, while binocular cameras (Kingfisher series cameras) do not have ScenePoint Cloud.
The figure below shows the Scene diagram of all samples. You can observe the posture distribution of the end of the robotic arm. If the end of the robotic arm is distributed evenly and the coordinate axis rotates at a larger angle, the calibration result is available.
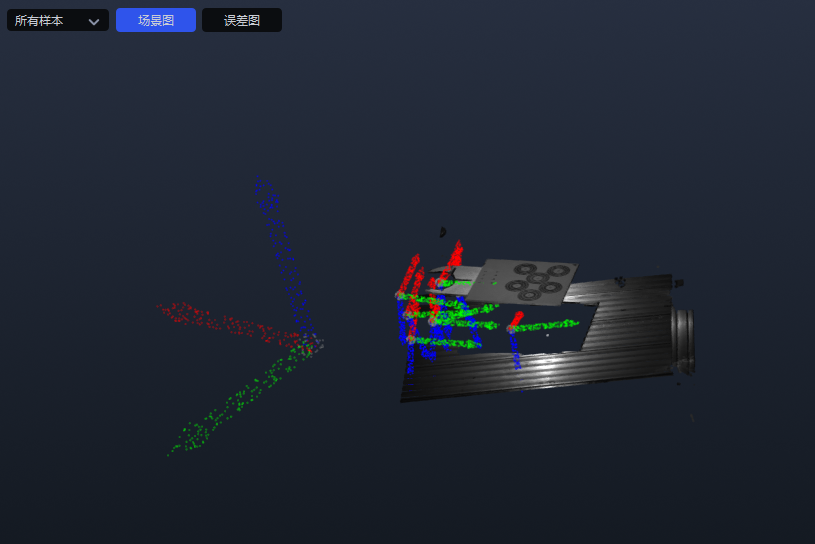
If the Scene diagram of all samples shows that the distribution of the end of the robot arm is relatively tight or the rotation angle of the coordinate axis is small, the calibration result is not available. You can switch the Scene diagram of `Sample
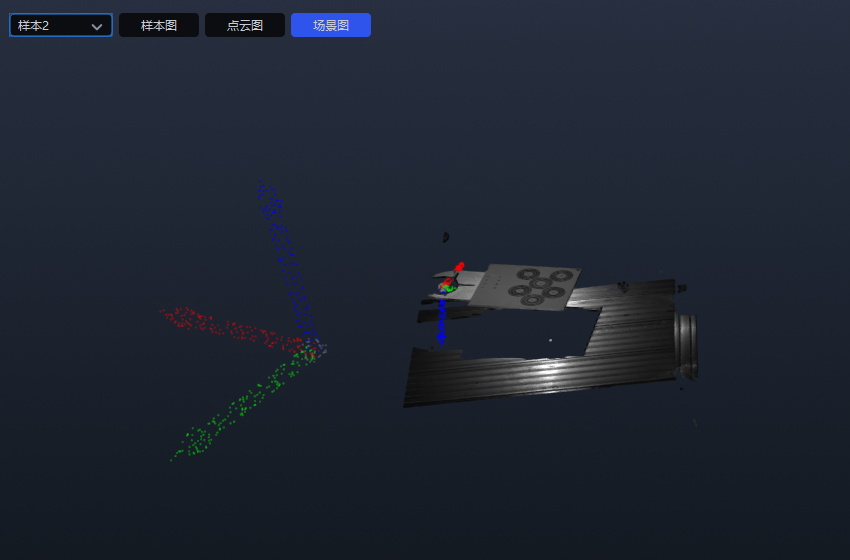
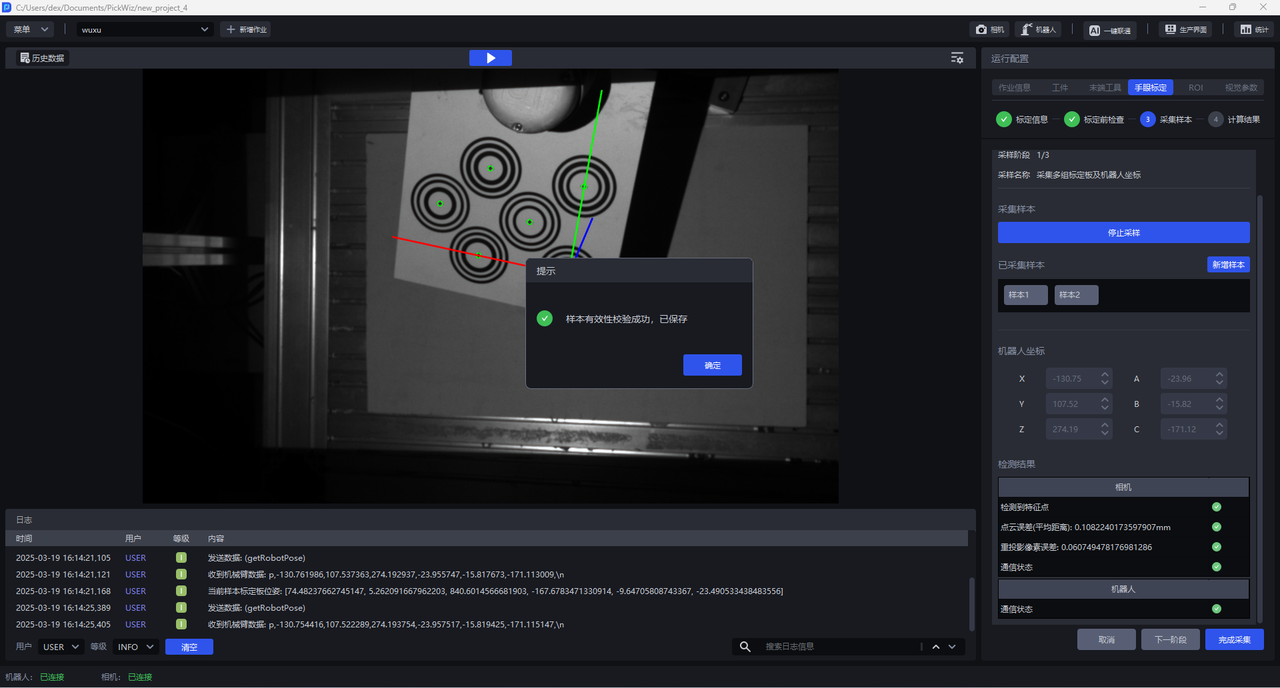
After finding the abnormal sample, if you select Yes for Get coordinates online, you should filter the sampling samples or recalibrate; if you select No for Get coordinates online', you should first check whether the order or unit of the manually entered Robot Pose is wrong. If there are any errors, correct them and click Calculate results` to recalculate the calibration results. If there are no errors, you should filter the sampling samples or **recalibrate. **
1.3 Point Cloud diagram
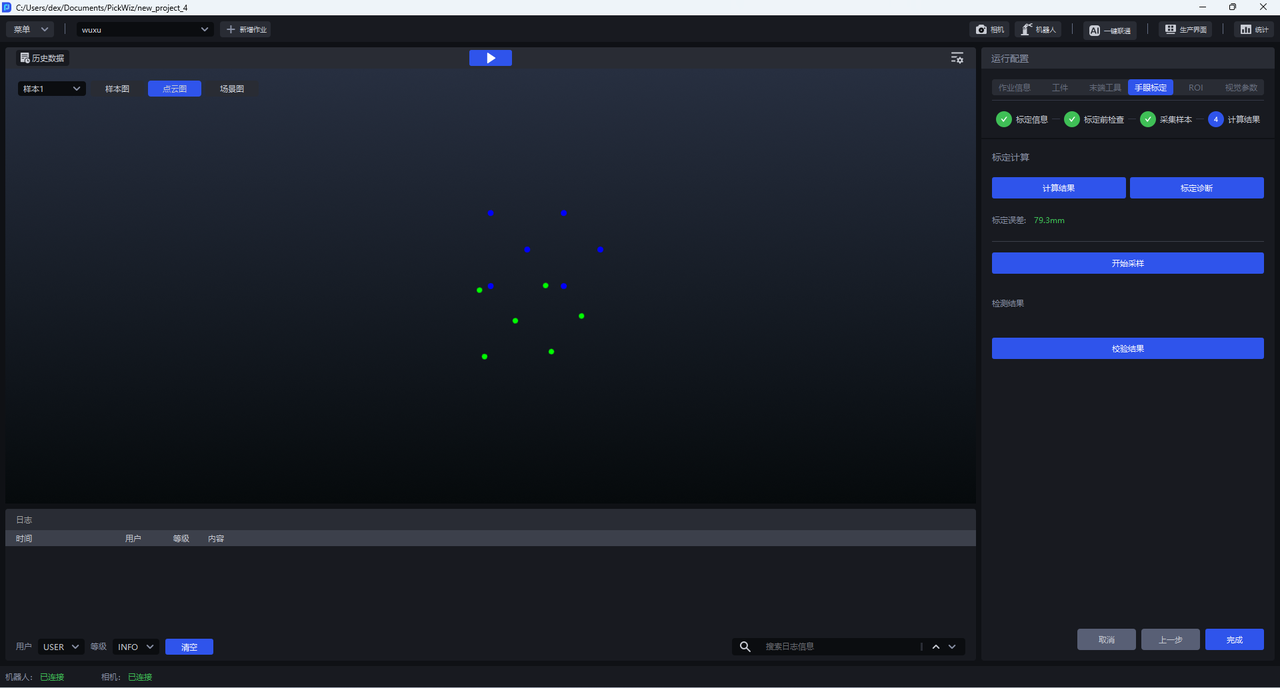
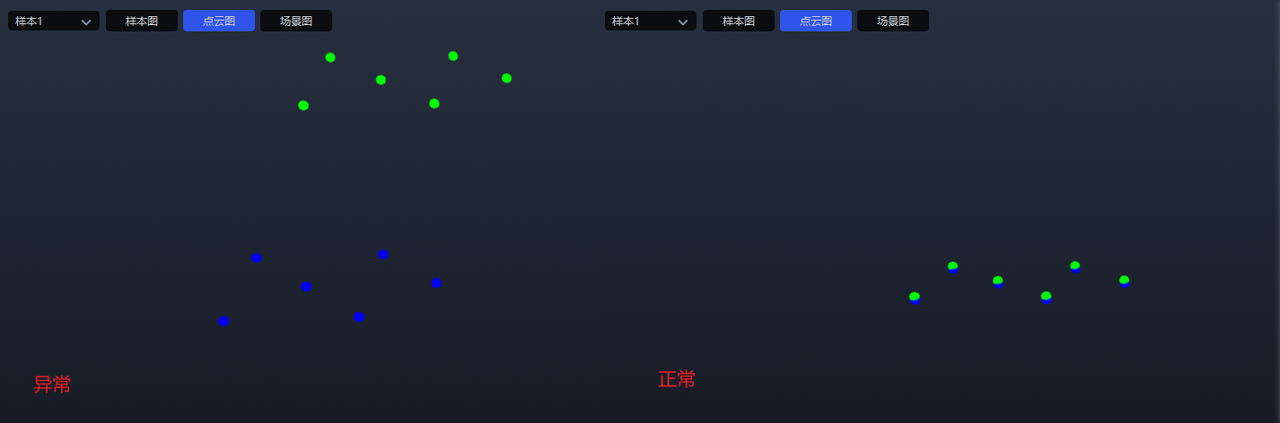
The Point Cloud diagram is used to display the reprojection of the Calibration Board at each sampling time. The blue point is the standard Calibration Board posture, and the green point is the posture of the Calibration Board after reprojection. The higher the coincidence between the blue point and the green point, the higher the accuracy of the calibration result.
Switch the Point Cloud graph of sample x to view the reprojection of the Calibration Board during each sampling, as shown in the figure below.
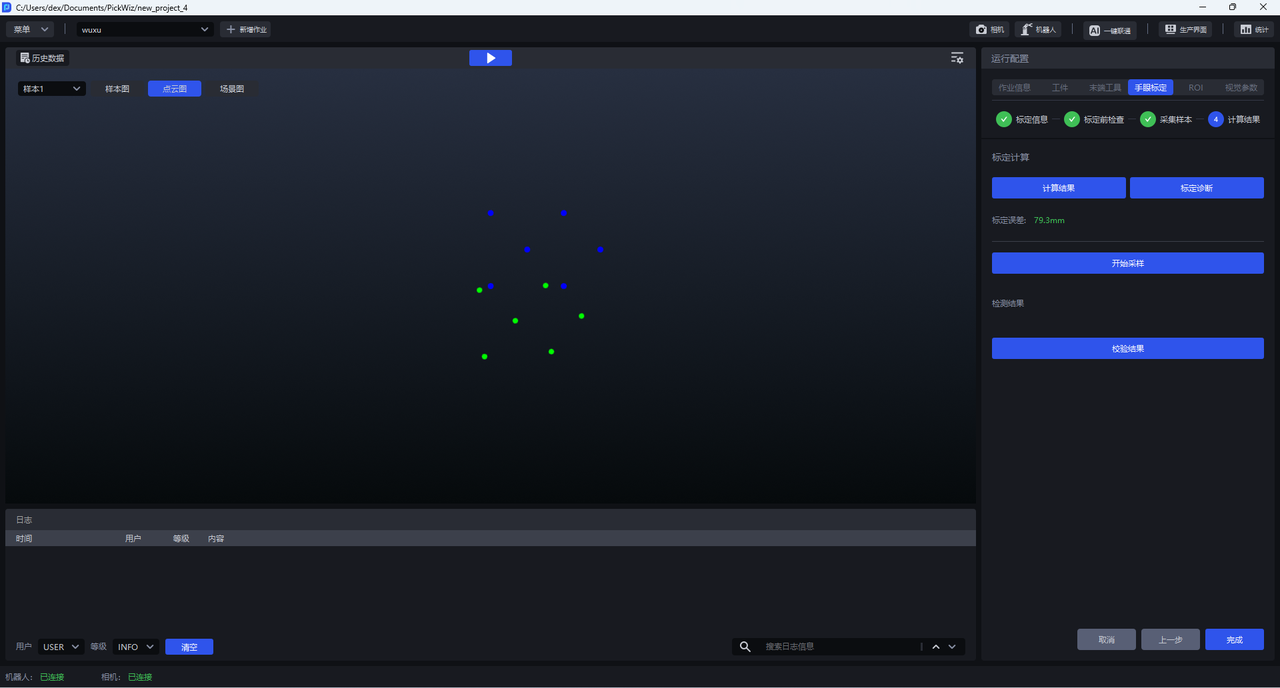
If the blue point and the green point do not overlap well or do not overlap at all, it means that the calibration result is not available. If you select Yes for Get coordinates online, you should filter the sampling samples or recalibrate; if you select No for Get coordinates online', you should first check whether the order or unit of the manually entered Robot Pose is wrong. If there are any errors, correct them and click Calculate results` to recalculate the calibration results. If there are no errors, you should filter the sampling samples or **recalibrate. **
2. Verify calibration results
After the Eye-hand calibration is completed, you can control the Robot tip tool to poke points and compare the coordinates of the robot arm with the coordinates given by vision to determine whether the calibration results meet the requirements.
Before calibration, you should confirm on the teaching pendant that the current coordinate system of the Robot is consistent with the coordinate system selected during calibration.
- Entering the
calculation resultsstage, place the Calibration Board used for calibration under the camera's field of view.
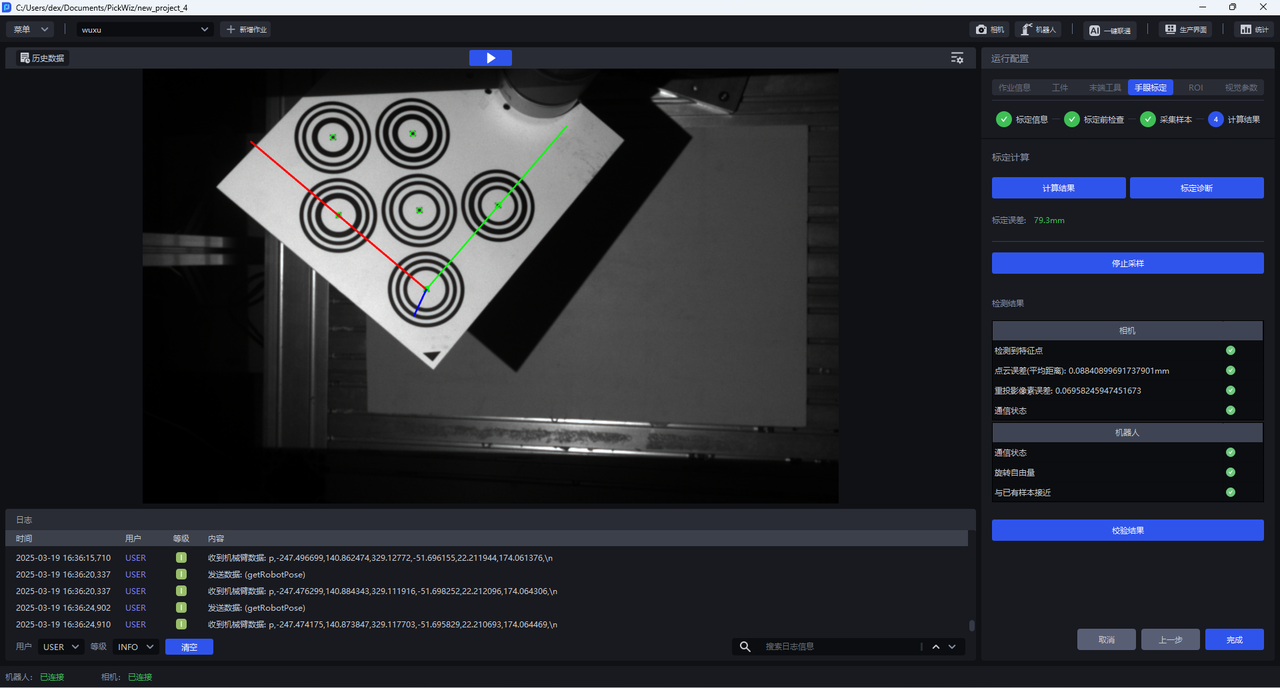
Click
Start Sampling, and theStart Samplingbutton will change toStop Sampling. After all the green icons of Camera detection and Robot detection are passed, a coordinate axis will appear on the Calibration Board in the visualization window, and the center of each concentric circle will turn green.Click the
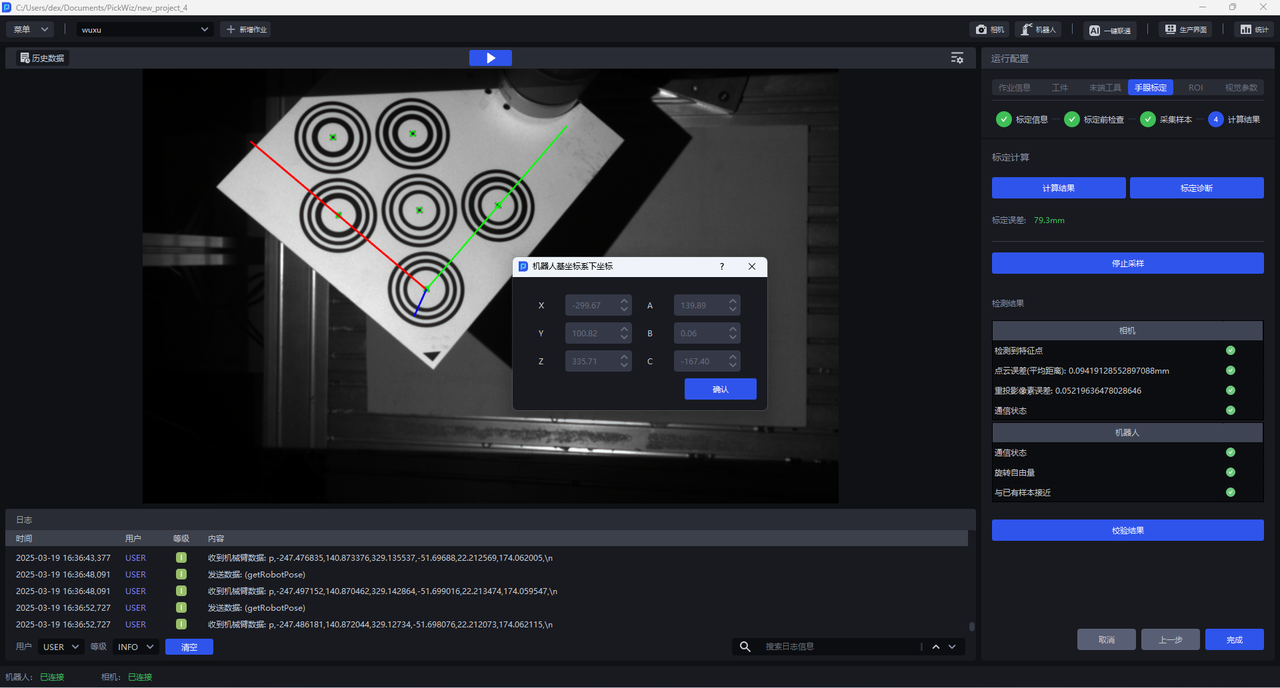
Verify Resultbutton, and theCoordinates in Robot base coordinate systempop-up window will appear. These coordinates are the coordinates of the coordinate axis center on the Calibration Board in the Robot base coordinate system.
If Get coordinates online is Yes, the coordinates will be automatically calculated, as shown in the figure below.
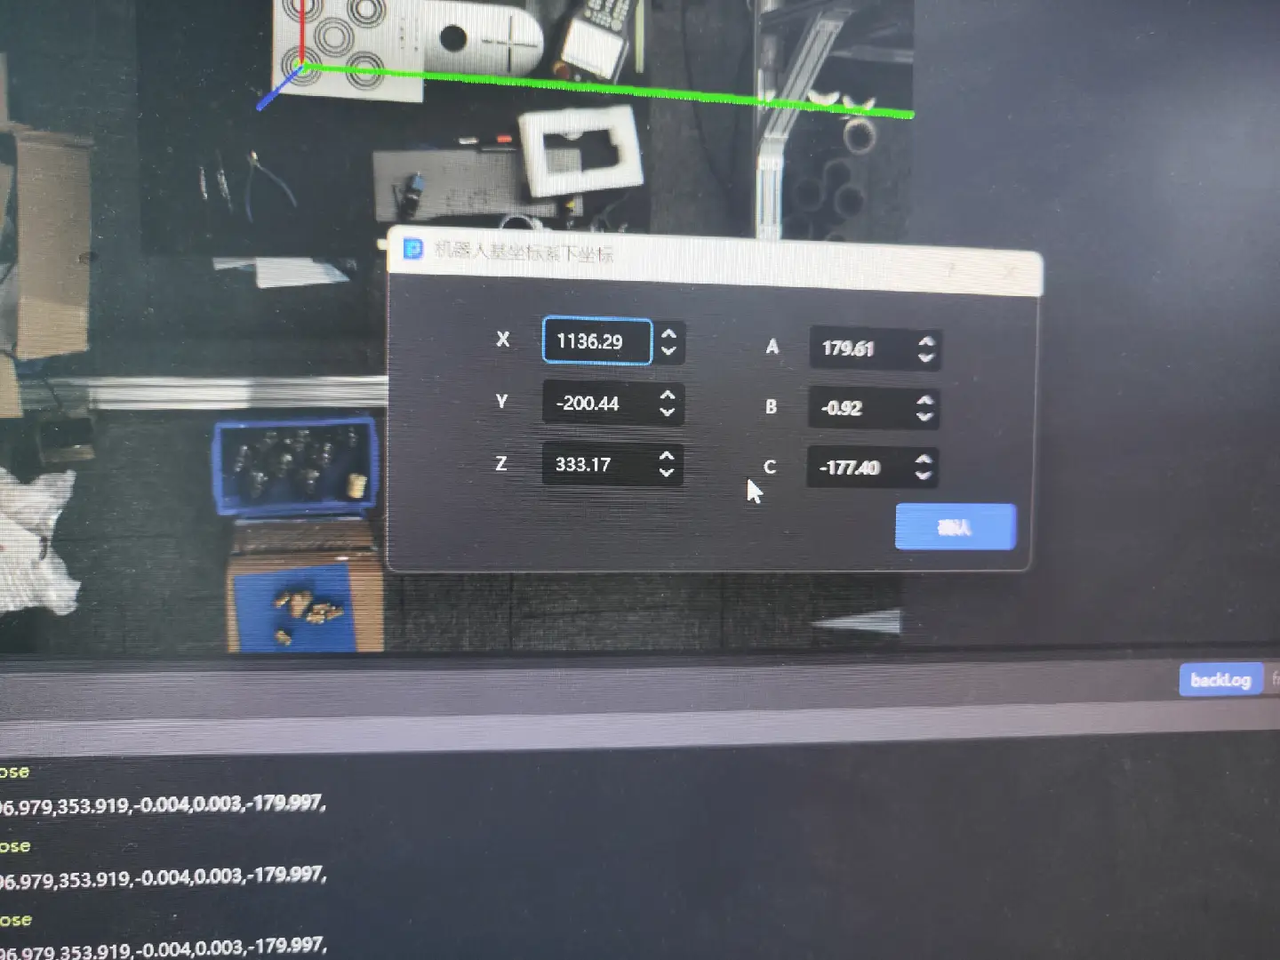
If Get coordinates online is No, you need to manually fill in the coordinates first, as shown in the figure below.
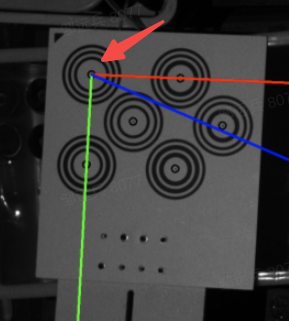
- Install a needle tip tool at the end of the robot arm, create a new tool coordinate at the end of the needle tip tool, and control the Robot to move so that the needle tip points to the center of the coordinate axis on the Calibration Board, as shown in the figure below.
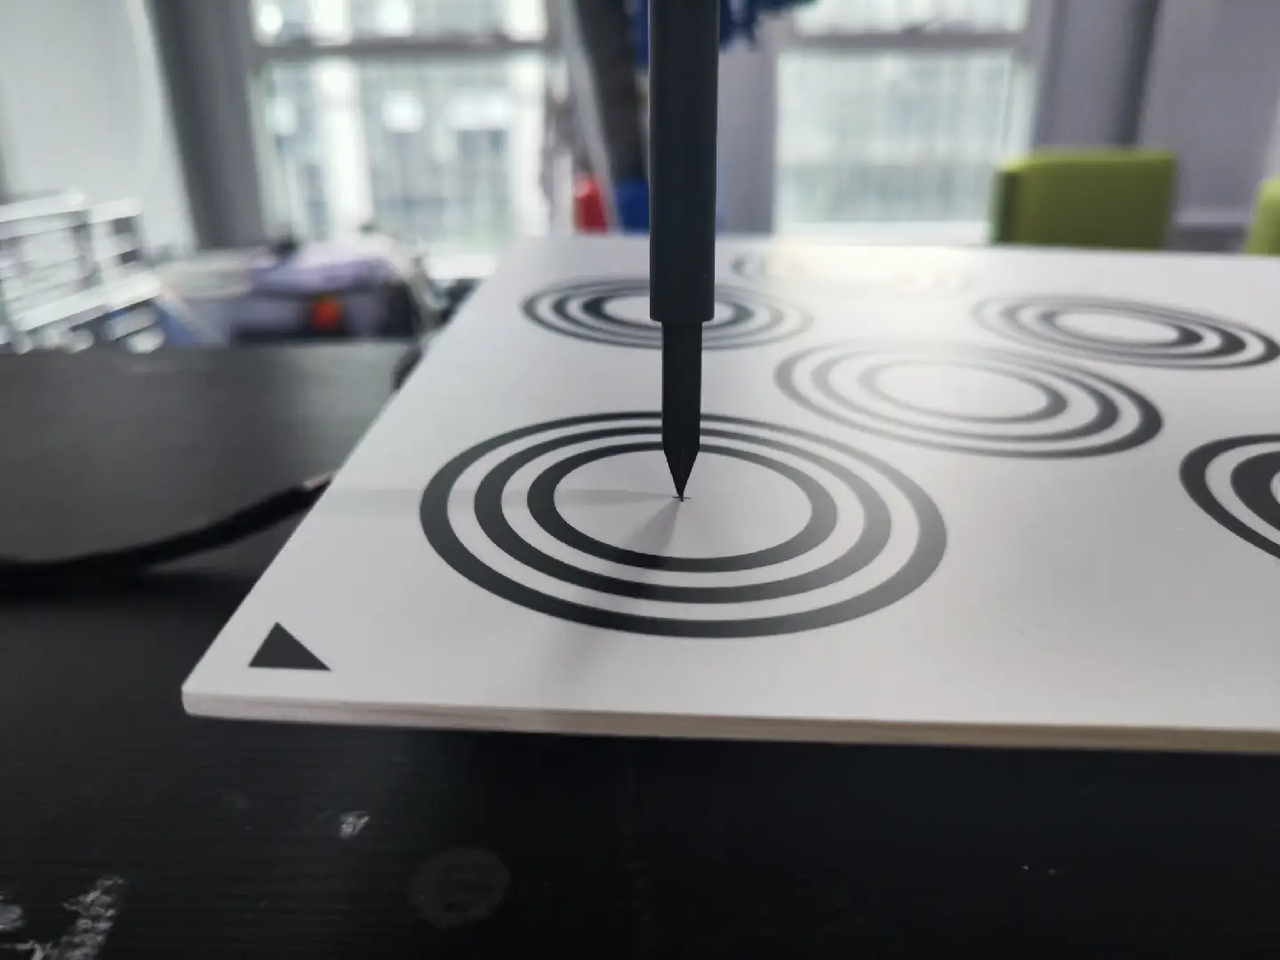
- Compare the needle tip coordinates given visually at this time with the needle tip coordinates on the Robot teaching pendant to determine whether the accuracy of the calibration results meets the requirements. If the difference between the two is small, the calibration result is available. Otherwise, the calibration result is not available. You should check whether the order or unit of the manual input pose is wrong, and check whether there is any deviation in the point poked by the needle tip tool. If the check is correct, recalibrate.
3. Filter sampling samples
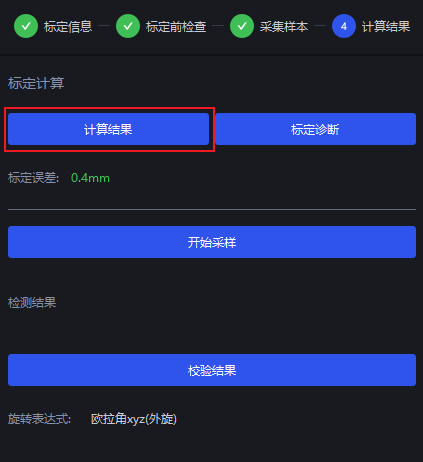
After clicking Calculation results, PickWiz will filter the samples with excessive errors among the collected samples and will not be included in the final calibration calculation. The grayed out samples can be viewed in the Collected Samples section of the sampling stage, and the filtered sample ID will be prompted below.
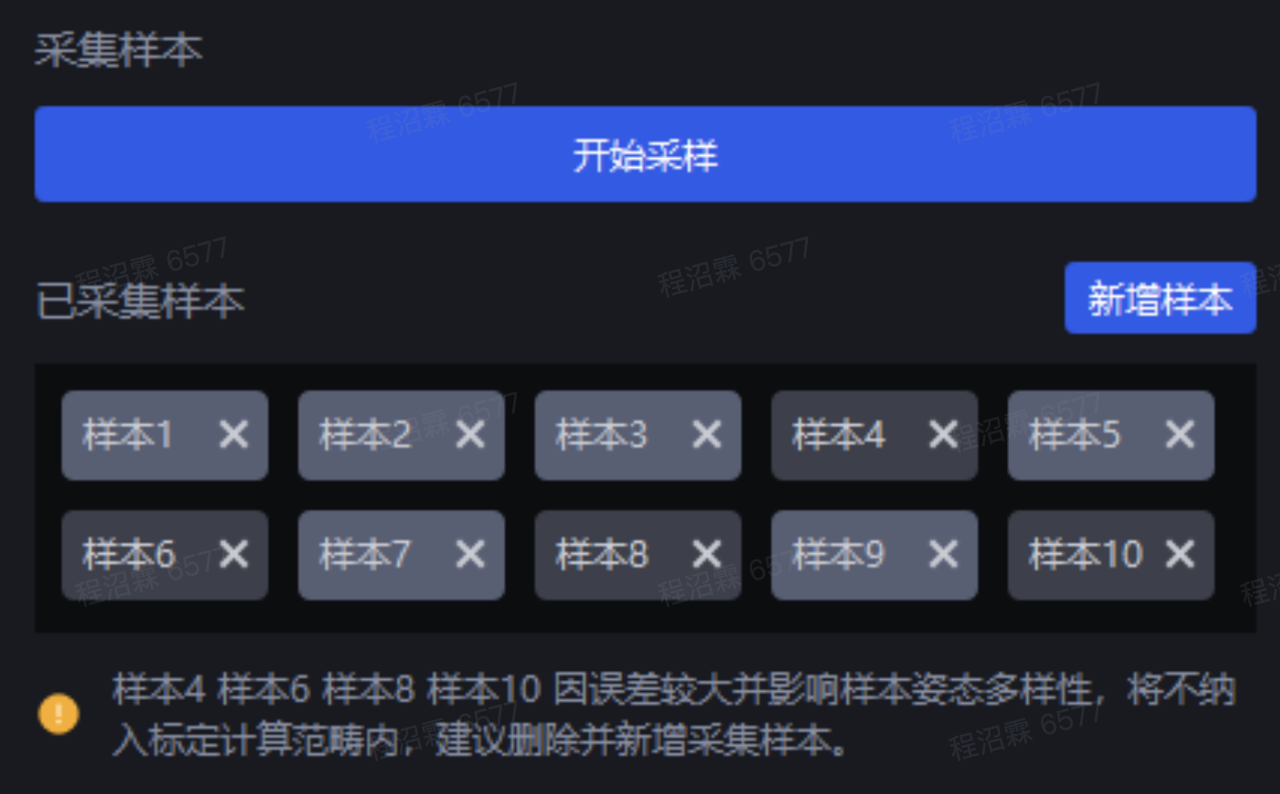
If the error graph, Scene graph, and Point Cloud graph of the sample in Calibration Diagnosis shows that the calibration accuracy is good, the filtered sample will be retained, otherwise the filtered sample will be deleted.