
Checking and Analyzing Calibration Results
After calibration, use calibration diagnostics and on-site validation to determine whether the result meets the project's accuracy requirements. If errors are abnormal, identify the cause, address abnormal samples, and recalculate. If the result still does not meet the requirements, recalibrate.
1. Open Calibration Diagnostics
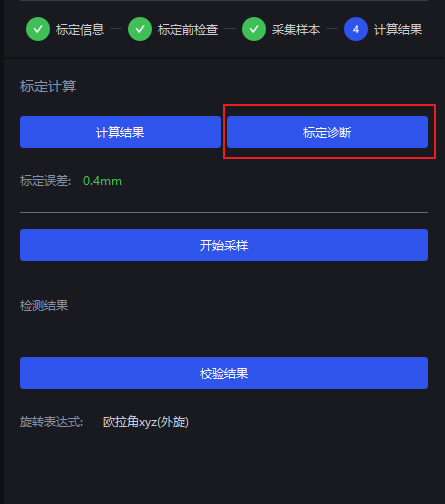
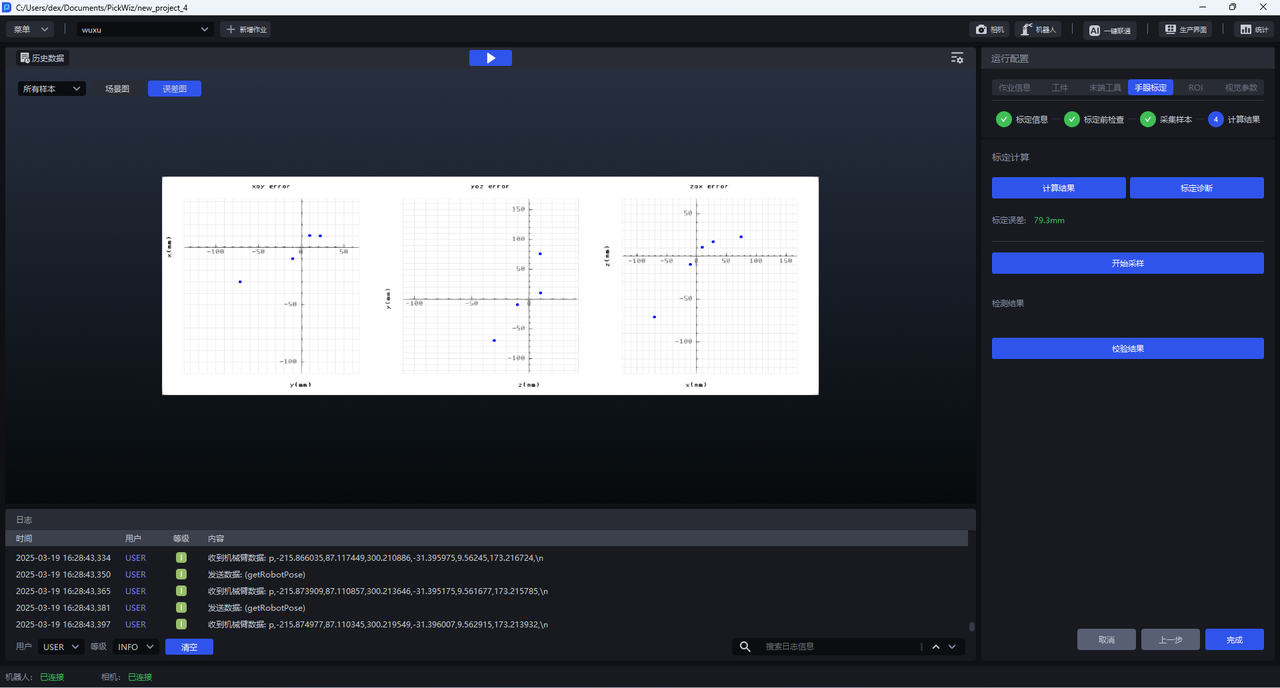
In the “Calibration Calculation” stage, click “Calibration Diagnostics.” The visualization window displays error plots and a scene view for all samples. You can also switch to an individual sample to view its sample image, scene view, and point cloud view.
2. Evaluate the Error Plots
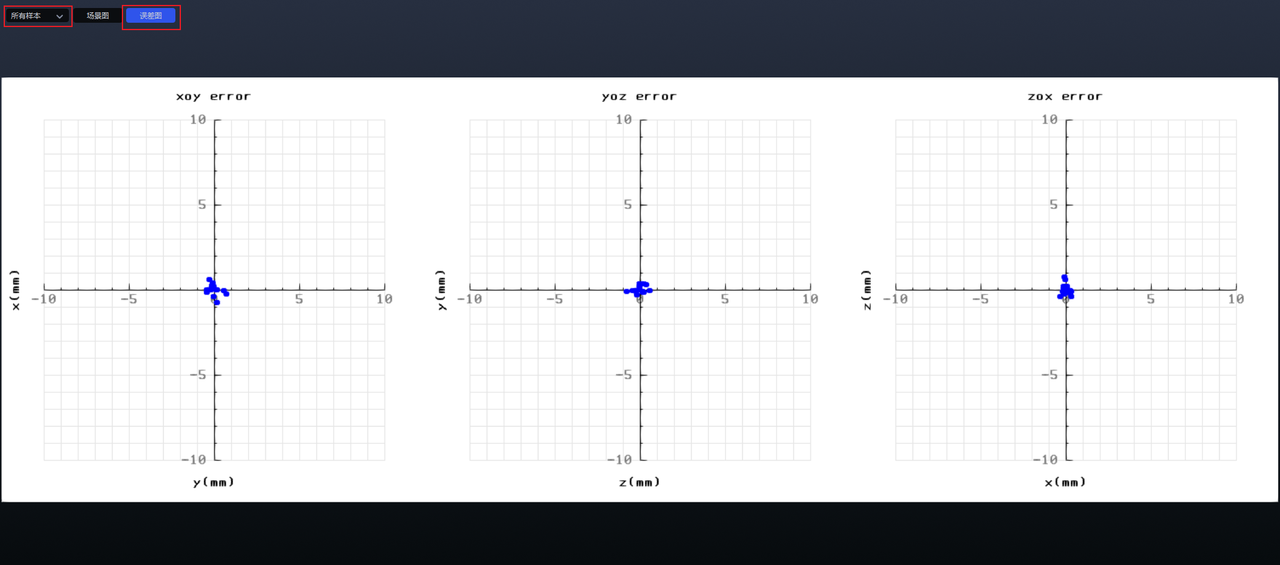
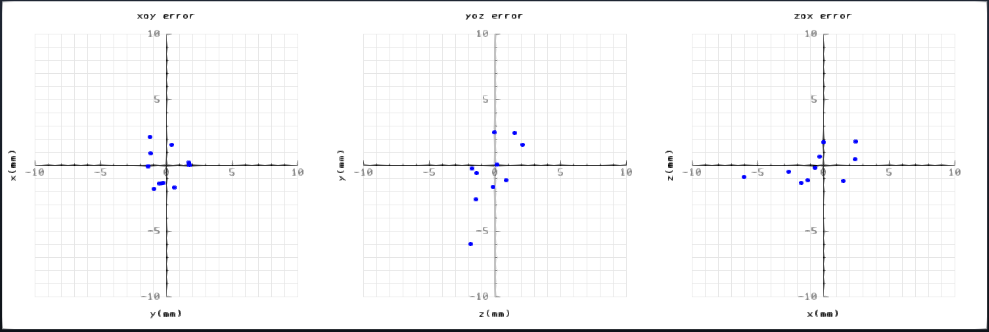
The error plots show the differences between the actual and calculated positions of the calibration board’s circle center on the XoY, YoZ, and ZoX planes. Each grid square represents 1 mm.
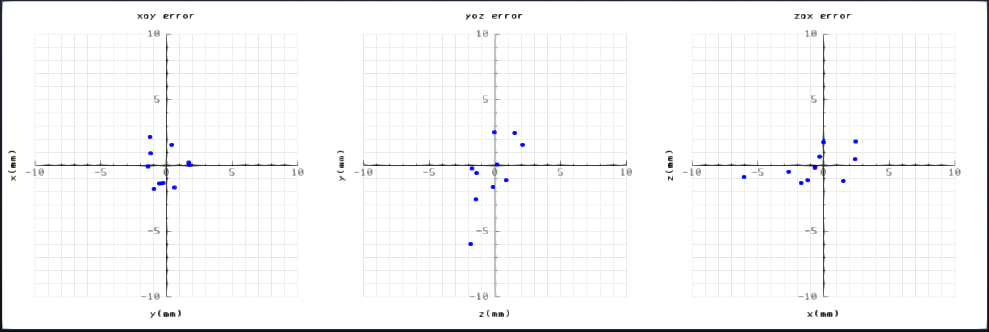
- Dots clustered at the center of all three plots: The error is small, and the result is usually usable
- Dots that are widely scattered or far from the center: The error is large; check for abnormal samples or recalibrate
3. Evaluate the Scene View
In the scene view, the larger coordinate axes represent the robot base coordinates, while the smaller coordinate axes represent the robot end-effector pose at each sampling point.
Structured-light cameras (Xema and Finch series) display the scene point cloud; stereo cameras (Kingfisher series) do not.
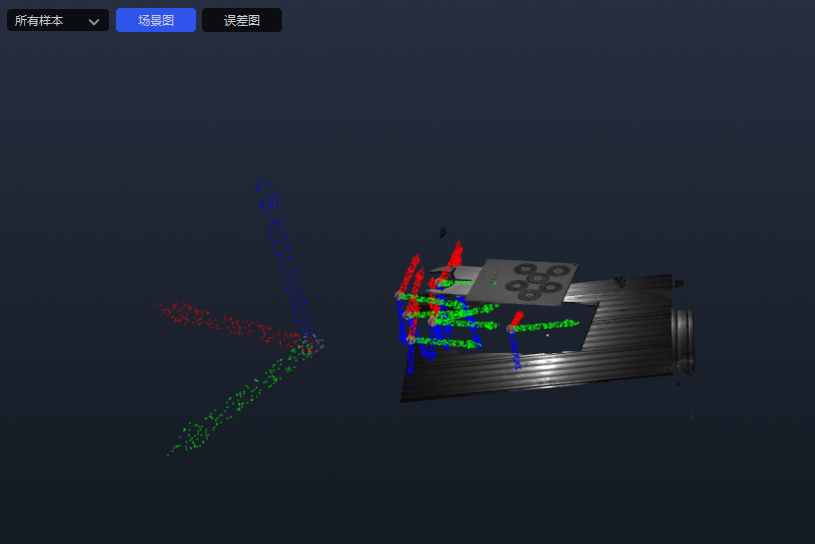
Usable samples usually have the following characteristics:
- Robot end-effector positions are distributed fairly evenly
- The coordinate axes have sufficient rotation
- The samples cover different areas of the camera’s field of view
If the poses are clustered or the rotation angles are too small, inspect each sample’s scene view to identify abnormal samples.
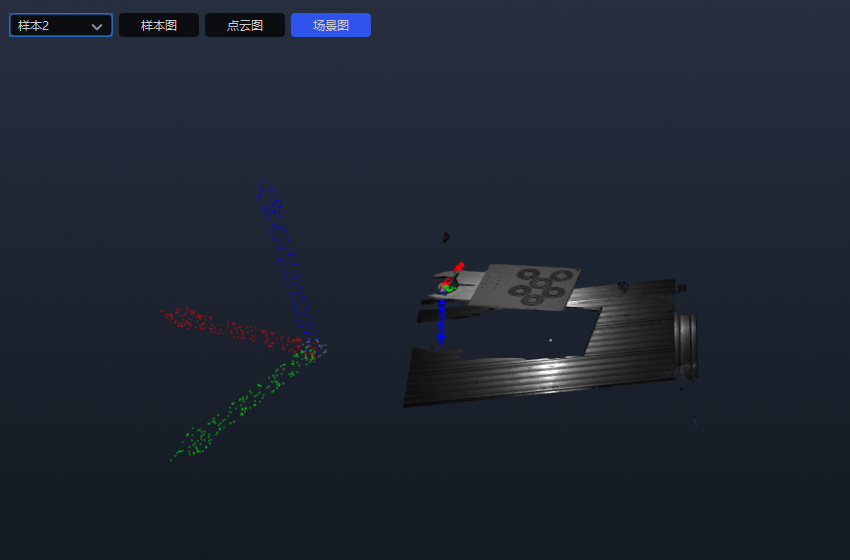
- If “Get Coordinates Online” is set to “Yes”: Filter out abnormal samples or collect them again
- If “Get Coordinates Online” is set to “No”: First check the field order and units of the manually entered pose. Recalculate after correcting them. If there are no input errors, filter out or recollect the abnormal samples
4. Evaluate the Point Cloud View
The point cloud view shows the reprojection result of the calibration board for each sample: Blue points indicate the standard calibration board pose, and green points indicate the reprojected pose. The greater their overlap, the better the calibration accuracy.
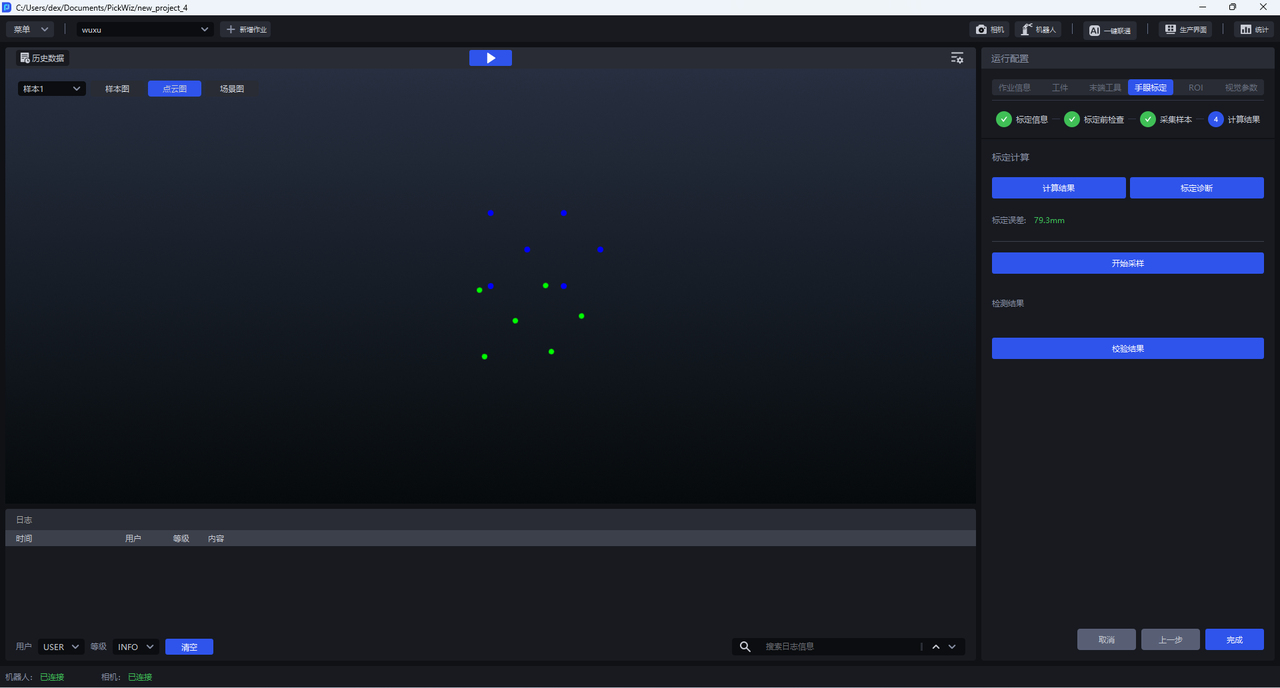
If the blue and green points are visibly misaligned:
- If “Get Coordinates Online” is set to “No,” first check the pose field order and units
- Inspect the sample image and scene view to determine whether calibration board recognition or the robot pose is abnormal
- Delete the abnormal sample and recalculate; if multiple samples are abnormal, recalibrate
5. Validate the Calibration Result
After the calibration diagnostics pass, it is recommended to use a needle-tip tool to compare the vision coordinates with the robot coordinates.
Before validation, confirm that the coordinate system currently used by the teach pendant is the same as the one used during calibration.
- In the “Calculation Results” stage, place the calibration board within the camera’s field of view
- Click “Start Sampling” and wait until both camera detection and robot detection pass
- Click “Validate Results” to obtain the coordinates of the calibration board’s coordinate-axis center in the robot base coordinate system
- If “Get Coordinates Online” is set to “Yes,” the system calculates automatically; if set to “No,” enter the robot pose manually
- Install a needle-tip tool on the robot end effector and set the tool coordinate at the needle tip
- Move the needle tip to point at the center of the calibration board’s coordinate axes
- Compare the needle-tip coordinates provided by the vision system with those shown on the teach pendant
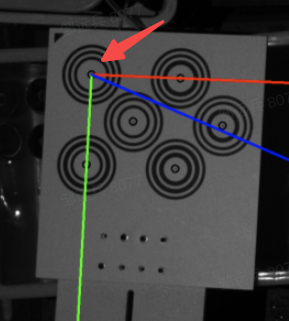
The calibration result is usable if the difference meets the project’s accuracy requirements. If the difference is large, check the coordinate system, the field order and units of the manually entered pose, the needle-tip tool coordinates, and the contact point. Recalibrate after confirming that these are correct.
6. Handle Filtered Samples
After you click “Calculation Results,” PickWiz automatically filters out samples with excessive errors and excludes them from the final calculation. Filtered samples appear grayed out in “Collected Samples,” and their sample IDs are displayed at the bottom of the page.
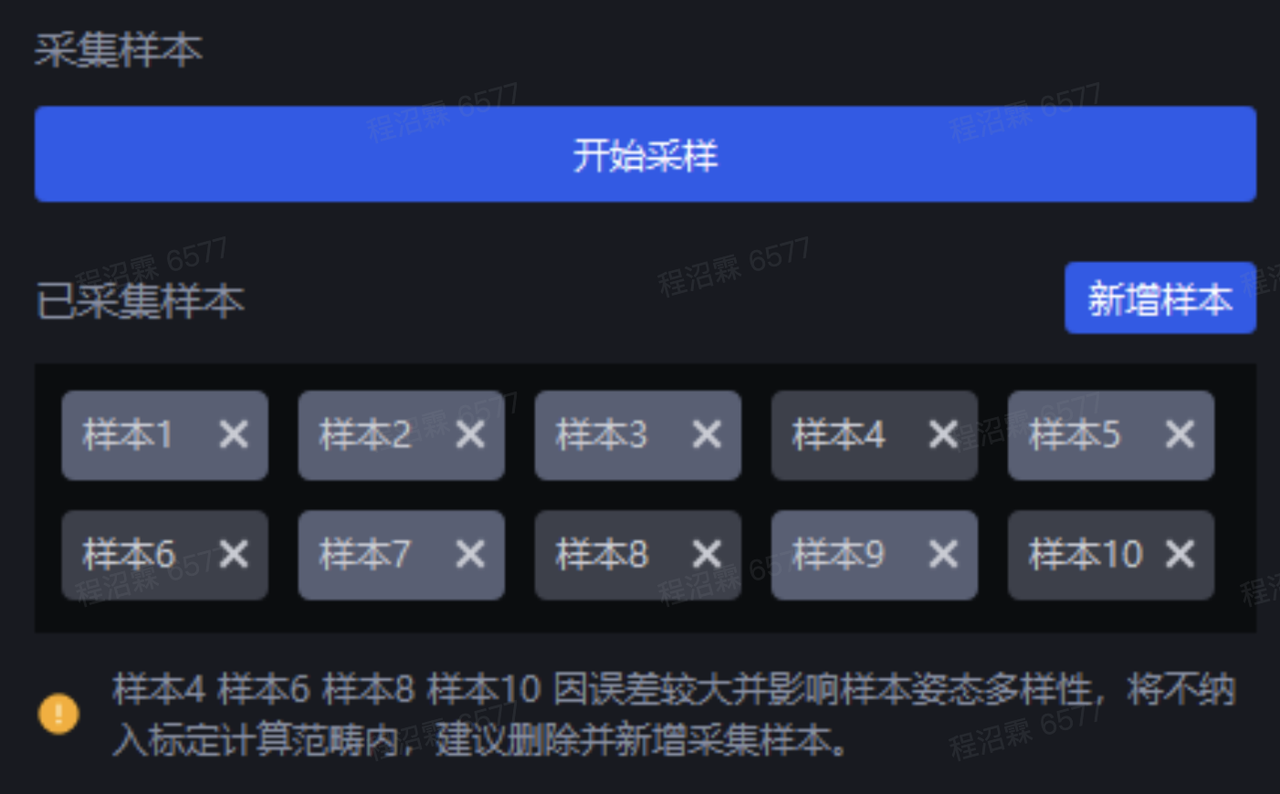
- If the error plots, scene view, and point cloud view are all normal, you can keep the sample record
- If the diagnostic results are abnormal, delete the sample and add a new one that provides better coverage
To troubleshoot camera, point cloud, or robot accuracy, see Common Issues and FAQ.